trusted online casino malaysia

Archive for the ‘Oracle’ Category.

Exatadata Book 2

I have been getting quite a few questions about our upcoming Exadata Book lately so I thought I would post a quick update. We are working feverishly on it so please give us a break!

Just kidding!

I am actually feeling like we can see the light at the end of the tunnel now. We are well past the half way mark and I am feeling confident about the content. Well more than confident actually. I think it’s going to be awesome! In large part that’s due to the fact that I feel like we have the Dream Team working on the project. Tanel Poder has signed on as a co-author. Kevin Closson is the Official Technical Reviewer (and we’re tentatively planning on including a number of his comments in the book – in little “Kevin Says” sidebars). As one of the main architects of Exadata, this should provide some interesting perspective. Arup Nanda has volunteered as an unofficial technical reviewer as well. I have to say that Arup has been a great help. And I really appreciate him providing another perspective on what we’re writing about. All three of these guys are fellow Oak Table bretheren, by the way. Randy Johnson is the other co-author, and although he generally prefers to keep a low profile, he is extremely knowledgeable on things that the rest of us don’t deal with that much on a day to day basis, namely backup and recovery and storage configuration. He has a great RAC and ASM background as well. I have to also say that a guy none of you has ever heard of (Andy Colvin) has been a huge help as well. He is our in-house Exadata patching guru. Without him I’m not sure we would have been able to do the necessary testing to complete the book.

I must say that I feel honored to be involved in a project with such an accomplished group of guys. And by the way, we have had numerous offers from people that I have a lot of respect for to help with various aspects of the project. I want to thank all of you for those offers, even if we haven’t taken you up on all of them (our little brains can only absorb so much feedback at any one time). The book is actually available for pre-order on the Amazon already (so someone must think we are actually going to finish it pretty soon). I think we’re  right on track for later spring delivery. 🙂

Most Expensive SQL Statement Ever

You know the cost calculation that the cost based optimizer (CBO) uses to determine which execution plan to choose for a SQL statement, right? If you don’t, you should immediately stop reading this and pick up a good novel instead. Ah, you’re still here? Well I got an interesting email today from one of my co-workers saying he had to kill a query yesterday. Actually that’s a big part of his current job. Killing runaway queries – apparently that job takes most of his time between 8 and 5. Anyway, he sent me this execution plan today, no comments, “just have a look at this”, he said.

---------------------------------------------------------------------------------------------------
| Id  | Operation              | Name             | Rows  | Bytes|TempSpc| Cost (%CPU)| Time     |
---------------------------------------------------------------------------------------------------
|   0 | SELECT STATEMENT       |                  |       |       |      |    65P(100)|          |
|   1 |  SORT ORDER BY         |                  |    18E|    15E|   15E|    65P (78)|999:59:59 |
|   2 |   COUNT                |                  |       |       |      |            |          |
|*  3 |    FILTER              |                  |       |       |      |            |          |
|   4 |     NESTED LOOPS       |                  |    18E|    15E|      |    14P  (3)|999:59:59 |
|   5 |      NESTED LOOPS      |                  |   984G|   216T|      |    14G  (3)|999:59:59 |
|   6 |       TABLE ACCESS FULL| CAT_6000_6001TBL |  7270K|  1074M|      |   176K  (3)| 00:15:46 |
|   7 |       TABLE ACCESS FULL| CAT_6000TBL      |   135K|    11M|      |  1950   (3)| 00:00:11 |
|   8 |      INDEX FULL SCAN   | PK_OBJECTS       |    32M|   306M|      | 15207   (3)| 00:01:22 |
---------------------------------------------------------------------------------------------------

So I had a look. Yes – that’s a 65P in the cost column. I’ve seen worse (but not in a production system). Cost is not always a good indication of run time, by the way. It’s just a sort of normalized estimation after all. But the estimate for the number of rows and bytes (18E and 15E) are very impressive as well. This query ran for several hours before my buddy finally killed it. As you might expect, the query was missing a join condition between a couple of large tables (7M and 32M).

Here’s a test I worked up to see how big a number I could get.

SYS@LAB1024> !cat dplan.sql
set lines 150
select * from table(dbms_xplan.display_cursor('&sql_id','&child_no','typical'))
/

SYS@LAB1024> @dplan
Enter value for sql_id: gf5nnx0pyfqq2
Enter value for child_no: 

PLAN_TABLE_OUTPUT
------------------------------------------------------------------------------------------------------------------------------------------------------
SQL_ID  gf5nnx0pyfqq2, child number 0
-------------------------------------
select a.col2, sum(a.col1) from kso.skew a, kso.skew b group by a.col2

Plan hash value: 321450672

-----------------------------------------------------------------------------------
| Id  | Operation               | Name    | Rows  | Bytes | Cost (%CPU)| Time     |
-----------------------------------------------------------------------------------
|   0 | SELECT STATEMENT        |         |       |       |   689G(100)|          |
|   1 |  HASH GROUP BY          |         |     1 |    16 |   689G (84)|999:59:59 |
|   2 |   MERGE JOIN CARTESIAN  |         |  1024T|    14P|   145G (22)|999:59:59 |
|   3 |    TABLE ACCESS FULL    | SKEW    |    32M|   488M| 10032  (18)| 00:01:21 |
|   4 |    BUFFER SORT          |         |    32M|       |   689G (84)|999:59:59 |
|   5 |     INDEX FAST FULL SCAN| SKEW_PK |    32M|       |  4558  (22)| 00:00:37 |
-----------------------------------------------------------------------------------


17 rows selected.

SYS@LAB1024> @dplan
Enter value for sql_id: 12p7fuydx3dd5
Enter value for child_no: 

PLAN_TABLE_OUTPUT
------------------------------------------------------------------------------------------------------------------------------------------------------
SQL_ID  12p7fuydx3dd5, child number 0
-------------------------------------
select a.col2, sum(a.col1) from kso.skew a, kso.skew b, kso.skew c group by
a.col2

Plan hash value: 175710540

------------------------------------------------------------------------------------
| Id  | Operation                | Name    | Rows  | Bytes | Cost (%CPU)| Time     |
------------------------------------------------------------------------------------
|   0 | SELECT STATEMENT         |         |       |       |    18E(100)|          |
|   1 |  HASH GROUP BY           |         |     1 |    16 |    18E (81)|999:59:59 |
|   2 |   MERGE JOIN CARTESIAN   |         |    18E|    15E|  4670P (22)|999:59:59 |
|   3 |    MERGE JOIN CARTESIAN  |         |  1024T|    14P|   145G (22)|999:59:59 |
|   4 |     TABLE ACCESS FULL    | SKEW    |    32M|   488M| 10032  (18)| 00:01:21 |
|   5 |     BUFFER SORT          |         |    32M|       |   145G (22)|999:59:59 |
|   6 |      INDEX FAST FULL SCAN| SKEW_PK |    32M|       |  4558  (22)| 00:00:37 |
|   7 |    BUFFER SORT           |         |    32M|       |    18E (81)|999:59:59 |
|   8 |     INDEX FAST FULL SCAN | SKEW_PK |    32M|       |  4558  (22)| 00:00:37 |
------------------------------------------------------------------------------------


21 rows selected.

SYS@LAB1024> @dplan
Enter value for sql_id: 7b53dxh6w6mpj
Enter value for child_no: 

PLAN_TABLE_OUTPUT
------------------------------------------------------------------------------------------------------------------------------------------------------
SQL_ID  7b53dxh6w6mpj, child number 0
-------------------------------------
select a.col2, sum(a.col1) from kso.skew a, kso.skew b, kso.skew c, kso.skew
d group by a.col2

Plan hash value: 3965951819

-------------------------------------------------------------------------------------
| Id  | Operation                 | Name    | Rows  | Bytes | Cost (%CPU)| Time     |
-------------------------------------------------------------------------------------
|   0 | SELECT STATEMENT          |         |       |       |    18E(100)|          |
|   1 |  HASH GROUP BY            |         |     1 |    16 |    18E  (0)|999:59:59 |
|   2 |   MERGE JOIN CARTESIAN    |         |    18E|    15E|    18E  (0)|999:59:59 |
|   3 |    MERGE JOIN CARTESIAN   |         |    18E|    15E|  4670P (22)|999:59:59 |
|   4 |     MERGE JOIN CARTESIAN  |         |  1024T|    14P|   145G (22)|999:59:59 |
|   5 |      TABLE ACCESS FULL    | SKEW    |    32M|   488M| 10032  (18)| 00:01:21 |
|   6 |      BUFFER SORT          |         |    32M|       |   145G (22)|999:59:59 |
|   7 |       INDEX FAST FULL SCAN| SKEW_PK |    32M|       |  4558  (22)| 00:00:37 |
|   8 |     BUFFER SORT           |         |    32M|       |  4670P (22)|999:59:59 |
|   9 |      INDEX FAST FULL SCAN | SKEW_PK |    32M|       |  4558  (22)| 00:00:37 |
|  10 |    BUFFER SORT            |         |    32M|       |    18E  (0)|999:59:59 |
|  11 |     INDEX FAST FULL SCAN  | SKEW_PK |    32M|       |  4558  (22)| 00:00:37 |
-------------------------------------------------------------------------------------


24 rows selected.


So it looks like the cost tops out at 18E as does the estimated number of rows. Oddly the number of bytes appears to top out at 15E. So the production query had maxed out the rows and bytes estimate although the cost was significantly under the max. Still 65P is the biggest cost I’ve seen in a production system. Anyone seen a bigger one?

P.S. I have two categories for SQL related posts. “Developer Tricks” and “Wall of Shame”. This one gets both tags.

storage(:Z>=:Z AND :Z

Ever wonder why that weird line shows up in the Predicate Section of an execution plan on Exadata? Me too! The STORAGE bit tells us it’s a filter applied at the storage cell layer, but the rest is nonsensical. Well I recently ran across a very brief mention of it in a Metalink note. (I know it’s not called Metalink any more, but I’m kind of set in my ways). The note said it was related to distribution of rows to PX slaves. Ah ha! Let’s test it out. Here’s a plan with the predicate just so you can see what it looks like.

KSO@arcp> @dplan
Enter value for sql_id: a9axwj6ym3b29
Enter value for child_no: 

PLAN_TABLE_OUTPUT
------------------------------------------------------------------------------------------------------------------------------------------------------
SQL_ID  a9axwj6ym3b29, child number 0
-------------------------------------
select /*+  parallel_index(t, "ISD_SI_I03",8)  dbms_stats
cursor_sharing_exact use_weak_name_resl dynamic_sampling(0)
no_monitoring no_substrb_pad  no_expand index_ffs(t,"ISD_SI_I03") */
count(*) as nrw,count(distinct sys_op_lbid(725425,'L',t.rowid)) as
nlb,count(distinct hextoraw(sys_op_descend("SUPPORT_LEVEL")||sys_op_desc
end("SUPPORT_LEVEL_KEY")||sys_op_descend("NAME")||sys_op_descend("VALUE"
))) as ndk,sys_op_countchg(substrb(t.rowid,1,15),1) as clf from
"ISD"."SUPPORT_INFO" sample block (   .0503530742,1)  t where
"SUPPORT_LEVEL" is not null or "SUPPORT_LEVEL_KEY" is not null or
"NAME" is not null or "VALUE" is not null

Plan hash value: 1766555783

---------------------------------------------------------------------------------------------------------------------------------------
| Id  | Operation                                   | Name       | Rows  | Bytes | Cost (%CPU)| Time     |    TQ  |IN-OUT| PQ Distrib |
---------------------------------------------------------------------------------------------------------------------------------------
|   0 | SELECT STATEMENT                            |            |       |       |   672 (100)|          |        |      |            |
|   1 |  SORT GROUP BY                              |            |     1 |    56 |            |          |        |      |            |
|   2 |   PX COORDINATOR                            |            |       |       |            |          |        |      |            |
|   3 |    PX SEND QC (RANDOM)                      | :TQ10001   |     1 |    56 |            |          |  Q1,01 | P->S | QC (RAND)  |
|   4 |     SORT GROUP BY                           |            |     1 |    56 |            |          |  Q1,01 | PCWP |            |
|   5 |      PX RECEIVE                             |            |     1 |    56 |            |          |  Q1,01 | PCWP |            |
|   6 |       PX SEND HASH                          | :TQ10000   |     1 |    56 |            |          |  Q1,00 | P->P | HASH       |
|   7 |        SORT GROUP BY                        |            |     1 |    56 |            |          |  Q1,00 | PCWP |            |
|   8 |         PX BLOCK ITERATOR                   |            |   397K|    21M|   672   (1)| 00:00:01 |  Q1,00 | PCWC |            |
|*  9 |          INDEX STORAGE SAMPLE FAST FULL SCAN| ISD_SI_I03 |   397K|    21M|   672   (1)| 00:00:01 |  Q1,00 | PCWP |            |
---------------------------------------------------------------------------------------------------------------------------------------

Predicate Information (identified by operation id):
---------------------------------------------------

   9 - storage(:Z>=:Z AND :Z<=:Z AND ("SUPPORT_LEVEL" IS NOT NULL OR "SUPPORT_LEVEL_KEY" IS NOT NULL OR "NAME" IS NOT NULL OR
              "VALUE" IS NOT NULL))
       filter(("SUPPORT_LEVEL" IS NOT NULL OR "SUPPORT_LEVEL_KEY" IS NOT NULL OR "NAME" IS NOT NULL OR "VALUE" IS NOT NULL))


37 rows selected.

Notice that the plan is for a PX statement. So how can we convince ourselves that it is a PX related predicate. We can try two tests.

  1. Let's see if we can find any SQL statements that have the predicate that aren't PX statements.
  2. Let's see if we can find any PX statements that don't have the predicate.

So here we go.
Continue reading ‘storage(:Z>=:Z AND :Z’ »

EHCC and the GET_COMPRESSION_TYPE function

Well I turned in the HCC chapter on the Exadata book last week and of course as is usually the case, I immediately ran across something kind of cool on the topic I just finished writing about. (we still have several editing passes though, so I can add it later). Anyway, although I don’t have time to post much these days, I thought this one would be a quick little snippet. So here it is.

The Compression Advisor is part of the DBMS_COMPRESSION package. Specifically it is the GET_COMPRESSION_RATIO procedure. This procedure is worthy of a separate post but I won’t discuss it here except to say that as of 11.2.0.2 you can use it to test HCC compression ratios on non-Exadata platforms. That’s pretty cool, but what I wanted to tell you about is a handy little function in the same package called GET_COMPRESSION_TYPE. This function can tell you exactly what level of compression has been applied to a single row. This can come in handy for investigating the inner workings of  HCC (or OLTP or BASIC compression for that matter).

As you probably already know, HCC is only applied to records loaded via direct path writes. Any updates cause rows to be migrated out of that storage format into blocks flagged for OLTP compression. Of course OLTP compression on a block only kicks in when a block is “full”. On top of this, altering a table to change it’s compression does not actually change the storage format of any existing records (unless you use the MOVE keyword). So you could load some data and then change the designation (say from QUERY LOW to QUERY HIGH). Rows that are inserted after the change will be stored in the new format (assuming the records are loaded via direct path writes of course). So why am I telling you all this. Well, because I ran across a statement in some Oracle documentation that said you can check to see what compression method a table is stored with by looking at the COMPRESS_FOR column in the DBA_TABLES view. This column does reveal what the table designation is. However, the setting actually only tells you how rows inserted in the future will be compressed. It tells you absolutely nothing about the way current rows are stored.

As for the mechanics, it appears that each row has a bitmask associated with it showing what compression format is being used. So I wrote a little script to give me what I want to see (check_row_comp.sql) using the DBMS_COMPRESSION.GET_COMPRESSION_TYPE function. Here’s an example of its use.

Continue reading ‘EHCC and the GET_COMPRESSION_TYPE function’ »

EHCC Mechanics – Proof that whole CU’s are not decompressed

I saw an interesting post recently where Greg Rahn talked about HCC mechanics. He claimed that an update to a record stored in HCC format did not require decompressing the whole Compression Unit (CU) which consist of several Oracle blocks. I’m assuming by this he meant that all the records contained in the CU did not get written back to storage in a non-HCC format due to a single record being updated. Greg then showed an example proving row migration occurred for an updated record. He didn’t show that the other records had not been decompressed though. So since I was already working on an HCC chapter for the upcoming Apress Exadata book, I thought I would take time off from the book writing to post this (hopefully the editors will forgive me).

Here’s the recipe: Basically we’ll update a single row, see that its rowid has changed, veify that we can still get to the record via its original rowid, and check to see if the TABLE FETCH CONTINUED ROW statistic gets updated when we we access the row via its original rowid, thus proving basic row migration (this is what Greg has already shown). Then we’ll look at block dumps for the original and new block to see what’s there.

Continue reading ‘EHCC Mechanics – Proof that whole CU’s are not decompressed’ »

Licensing Requirements for SQL Profiles

Jonathan Lewis reminded me on my last post that using SQL Profiles (because they are part of the SQL Tuning Advisor) requires a license for Oracle Tuning Pack (which requires a license for the Diagnostics Pack). He also mentioned that Baselines did not require any additional license (at least creating and using Baselines on SQL statements). It’s been a while since I worked on a database that didn’t have both packs, but frankly I wasn’t sure I had a good handle of what was allowed and what wasn’t. So I thought it might be worthwhile to check. There is an easy way to check by the way. I did a post a while back on Tuning Pack and Diagnostic Pack license requirements for running AWR and how to check what was allowed and what wasn’t using the CONTROL_MANAGEMENT_PACK_ACCESS parameter. Here’s a link to the post:

Oracle Management Packs

Here’s an example using the same technique to show that SQL Profiles are indeed disabled by turning off the Diagnostic and Tuning Packs (at least on 11.2.02).

Continue reading ‘Licensing Requirements for SQL Profiles’ »

SQL Profiles Disable Automatic Dynamic Sampling

I had an interesting email exchange with a fellow Oracle practitioner, Bryan Grenn, about differences between SQL Profiles and Baselines last week. Basically Bryan observed that SQL Profiles appeared to disable Dynamic Sampling on Global Temporary Tables while Baselines did not. This caused the optimizer’s cost calculations (and therefore the estimated elapsed runtimes) to be incorrect – sometime grossly incorrect. So I did a little follow up testing with a GTT. I used 2 test cases inserting either one row or 100,000 rows into the GTT. With Dynamic Sampling the plans were different (as you might expect). I then tested with Profiles to see how the statement behaved. Here’s is some of the output I generated during the test (note this test was done on an Exadata but non-Exadata environments exhibit the same behavior):
Continue reading ‘SQL Profiles Disable Automatic Dynamic Sampling’ »

Funny Developer Tricks – (substr(cust_id,1,length(:b1))

Ha. This one was a little surprising. I ran across a SQL statement that gets fired off hundreds at a time in rapid succession. Each execution taking several seconds – too long for thousands of executions in a row. The statement looked like this (cleaned up to protect the guilty):

b1 := '10355P034001SGL00066';
b2 := '10355P034001SGL00066';

select count(cust_id) 
from customers
where substr(cust_id,1,length(:b1)) = :b2;

What was the developer trying to do? How can we fix it? Your comments are welcomed.

Continue reading ‘Funny Developer Tricks – (substr(cust_id,1,length(:b1))’ »

Interaction Between Baselines and SQL Profiles

In a previous post (GATHER_PLAN_STATISTICS) I mentioned that SQL Profiles and Baselines can both be applied to a single statement. In this case, it appears that the hints are merged. The Notes section of the XPLAN output shows that both the Baseline and the Profile are in effect. I wanted to prove to myself that the hints from both the Profile and Baseline were indeed applied. So here’s my simple test case:

Basic Design For the Test:

  1. Use a Baseline to make a statement do something it wouldn’t normally do
  2. Add a Profile that makes the same statement do something else it wouldn’t normally do
  3. Verify that the statement now does both “thingies”
> !sql
sqlplus "/ as sysdba"

SQL*Plus: Release 11.2.0.1.0 Production on Tue Feb 2 20:09:53 2010

Copyright (c) 1982, 2009, Oracle.  All rights reserved.


Connected to:
Oracle Database 11g Enterprise Edition Release 11.2.0.1.0 - Production
With the Partitioning, OLAP, Data Mining and Real Application Testing options

SYS@LAB112> -- first the set up
SYS@LAB112> -- 32M row table with an index on col1
SYS@LAB112> !cat avgskewi.sql
select avg(pk_col) from kso.skew
where col1 = 136133
/

SYS@LAB112> @avgskewi

AVG(PK_COL)
-----------
   15636133

1 row selected.

Elapsed: 00:00:00.00
SYS@LAB112>
SYS@LAB112> @find_sql
Enter value for sql_text: %where col1 = 136133%
Enter value for sql_id: 

SQL_ID         CHILD  PLAN_HASH      EXECS     AVG_ETIME      AVG_LIO SQL_TEXT
------------- ------ ---------- ---------- ------------- ------------ ------------------------------------------------------------
84q0zxfzn5u6s      0 3723858078          3           .00           36 select avg(pk_col) from kso.skew where col1 = 136133

1 row selected.

Elapsed: 00:00:00.12
SYS@LAB112>
SYS@LAB112> @dplan
Enter value for sql_id: 84q0zxfzn5u6s
Enter value for child_no: 

PLAN_TABLE_OUTPUT
------------------------------------------------------------------------------------------------------------------------------------------------------
SQL_ID  84q0zxfzn5u6s, child number 0
-------------------------------------
select avg(pk_col) from kso.skew where col1 = 136133

Plan hash value: 3723858078

------------------------------------------------------------------------------------------
| Id  | Operation                    | Name      | Rows  | Bytes | Cost (%CPU)| Time     |
------------------------------------------------------------------------------------------
|   0 | SELECT STATEMENT             |           |       |       |    35 (100)|          |
|   1 |  SORT AGGREGATE              |           |     1 |    24 |            |          |
|   2 |   TABLE ACCESS BY INDEX ROWID| SKEW      |    35 |   840 |    35   (0)| 00:00:01 |
|*  3 |    INDEX RANGE SCAN          | SKEW_COL1 |    35 |       |     3   (0)| 00:00:01 |
------------------------------------------------------------------------------------------

Predicate Information (identified by operation id):
---------------------------------------------------

   3 - access("COL1"=136133)


20 rows selected.

Elapsed: 00:00:00.03
SYS@LAB112>
SYS@LAB112> -- so the index is used as expected - does 36 lio's and completes in < 1/100 of a second
SYS@LAB112> -- now let's make it do something it wouldn't normally do (with a Baseline)
SYS@LAB112> -- one way is to create a Profile, create a Baseline on top, drop the Profile
SYS@LAB112>
SYS@LAB112>
SYS@LAB112> 
SYS@LAB112> @create_1_hint_sql_profile
Enter value for sql_id: 84q0zxfzn5u6s
Enter value for profile_name (PROFILE_sqlid_MANUAL): PROFILE_84q0zxfzn5u6s_GPS
Enter value for category (DEFAULT): 
Enter value for force_matching (false): 
Enter value for hint: full(skew@sel$1)
Profile PROFILE_84q0zxfzn5u6s_FULL created.

PL/SQL procedure successfully completed.

SYS@LAB112> @avgskewi

AVG(PK_COL)
-----------
   15636133

Elapsed: 00:00:12.71
SYS@LAB112>
SYS@LAB112> @find_sql
Enter value for sql_text: 
Enter value for sql_id: 84q0zxfzn5u6s

no rows selected

Elapsed: 00:00:00.18
SYS@LAB112>
SYS@LAB112> -- run again, SPM makes you run it twice ...   
SYS@LAB112> 
SYS@LAB112> @avgskewi

AVG(PK_COL)
-----------
   15636133

Elapsed: 00:00:07.32
SYS@LAB112>
SYS@LAB112> @find_sql
Enter value for sql_text: 
Enter value for sql_id: 84q0zxfzn5u6s

SQL_ID         CHILD  PLAN_HASH      EXECS     AVG_ETIME      AVG_LIO SQL_TEXT
------------- ------ ---------- ---------- ------------- ------------ ------------------------------------------------------------
84q0zxfzn5u6s      0  568322376          1          7.31      162,301 select avg(pk_col) from kso.skew where col1 = 136133

Elapsed: 00:00:00.10
SYS@LAB112>
SYS@LAB112> @dplan
Enter value for sql_id: 84q0zxfzn5u6s
Enter value for child_no: 

PLAN_TABLE_OUTPUT
------------------------------------------------------------------------------------------------------------------------------------------------------
SQL_ID  84q0zxfzn5u6s, child number 0
-------------------------------------
select avg(pk_col) from kso.skew where col1 = 136133

Plan hash value: 568322376

---------------------------------------------------------------------------
| Id  | Operation          | Name | Rows  | Bytes | Cost (%CPU)| Time     |
---------------------------------------------------------------------------
|   0 | SELECT STATEMENT   |      |       |       | 28360 (100)|          |
|   1 |  SORT AGGREGATE    |      |     1 |    24 |            |          |
|*  2 |   TABLE ACCESS FULL| SKEW |    35 |   840 | 28360   (1)| 00:05:41 |
---------------------------------------------------------------------------

Predicate Information (identified by operation id):
---------------------------------------------------

   2 - filter("COL1"=136133)

Note
-----
   - SQL profile PROFILE_84q0zxfzn5u6s_FULL used for this statement


23 rows selected.

Elapsed: 00:00:00.05
SYS@LAB112>
SYS@LAB112> -- so it's now doing a full table scan, 162K lio's and takes several seconds
SYS@LAB112> 
SYS@LAB112> -- now create the Baseline on the statement that's already using a Profile
SYS@LAB112> 
SYS@LAB112> @create_baseline
Enter value for sql_id: 84q0zxfzn5u6s
Enter value for plan_hash_value: 568322376
Enter value for fixed (NO): 
Enter value for enabled (YES): 
Enter value for plan_name (SQL_sqlid_planhashvalue): 
sql_id: 84q0zxfzn5u6s
plan_hash_value: 568322376
fixed: NO
enabled: YES
plan_name: SQL_84q0zxfzn5u6s_568322376
sql_handle: SYS_SQL_94dc89c011141f02
Baseline SQL_84q0zxfzn5u6s_568322376 created.

PL/SQL procedure successfully completed.

Elapsed: 00:00:00.06
SYS@LAB112>
SYS@LAB112> @avgskewi                       

AVG(PK_COL)
-----------
   15636133

Elapsed: 00:00:07.44
SYS@LAB112> @avgskewi

AVG(PK_COL)
-----------
   15636133

Elapsed: 00:00:07.52
SYS@LAB112>
SYS@LAB112> -- obviously still doing the full table scan, but let's check anyway
SYS@LAB112> 
SYS@LAB112> @dplan
Enter value for sql_id: 84q0zxfzn5u6s
Enter value for child_no: 

PLAN_TABLE_OUTPUT
------------------------------------------------------------------------------------------------------------------------------------------------------
SQL_ID  84q0zxfzn5u6s, child number 0
-------------------------------------
select avg(pk_col) from kso.skew where col1 = 136133

Plan hash value: 568322376

---------------------------------------------------------------------------
| Id  | Operation          | Name | Rows  | Bytes | Cost (%CPU)| Time     |
---------------------------------------------------------------------------
|   0 | SELECT STATEMENT   |      |       |       | 28360 (100)|          |
|   1 |  SORT AGGREGATE    |      |     1 |    24 |            |          |
|*  2 |   TABLE ACCESS FULL| SKEW |    35 |   840 | 28360   (1)| 00:05:41 |
---------------------------------------------------------------------------

Predicate Information (identified by operation id):
---------------------------------------------------

   2 - filter("COL1"=136133)

Note
-----
   - SQL profile PROFILE_84q0zxfzn5u6s_FULL used for this statement
   - SQL plan baseline SQL_84Q0ZXFZN5U6S_568322376 used for this statement


24 rows selected.

Elapsed: 00:00:00.03
SYS@LAB112>
SYS@LAB112> -- let's check hints in Profile and Baseline
SYS@LAB112> 
SYS@LAB112> @sql_profile_hints
Enter value for profile_name: PROFILE_84q0zxfzn5u6s_FULL

HINT
------------------------------------------------------------------------------------------------------------------------------------------------------
full(skew@sel$1)

1 rows selected.

Elapsed: 00:00:00.10
SYS@LAB112>
SYS@LAB112> @baseline_hints
Enter value for baseline_plan_name: SQL_84Q0ZXFZN5U6S_568322376

OUTLINE_HINTS
------------------------------------------------------------------------------------------------------------------------------------------------------
IGNORE_OPTIM_EMBEDDED_HINTS
OPTIMIZER_FEATURES_ENABLE('11.2.0.1')
DB_VERSION('11.2.0.1')
ALL_ROWS
OUTLINE_LEAF(@"SEL$1")
FULL(@"SEL$1" "SKEW"@"SEL$1")

6 rows selected.

Elapsed: 00:00:00.09
SYS@LAB112>
SYS@LAB112> -- so the Baseline has inherited the full hint
SYS@LAB112> 
SYS@LAB112> -- now let's drop the original Profile and add another non-standard hint to see if they are merged
SYS@LAB112> 
SYS@LAB112> @drop_sql_profile
Enter value for profile_name: PROFILE_84q0zxfzn5u6s_FULL

PL/SQL procedure successfully completed.

Elapsed: 00:00:00.02
SYS@LAB112>
SYS@LAB112> @create_1_hint_sql_profile
Enter value for sql_id: 84q0zxfzn5u6s
Enter value for profile_name (PROFILE_sqlid_MANUAL): PROFILE_84q0zxfzn5u6s_GPS
Enter value for category (DEFAULT): 
Enter value for force_matching (false): 
Enter value for hint: GATHER_PLAN_STATISTICS
Profile PROFILE_84q0zxfzn5u6s_GPS created.

PL/SQL procedure successfully completed.

Elapsed: 00:00:00.05
SYS@LAB112> @avgskewi

AVG(PK_COL)
-----------
   15636133

1 row selected.

Elapsed: 00:00:07.51
SYS@LAB112> /

AVG(PK_COL)
-----------
   15636133

1 row selected.

Elapsed: 00:00:08.22
SYS@LAB112>
SYS@LAB112> -- if that worked we should still have the full table scan from the Baseline, and the extended stats from the Profile with GATHER_PLAN_STATISTICS
SYS@LAB112> 
SYS@LAB112> !cat dplan_allstats.sql
set lines 180
select * from table(dbms_xplan.display_cursor('&sql_id','&child_no','allstats  +peeked_binds'))
/

SYS@LAB112> @dplan_allstats
Enter value for sql_id: 84q0zxfzn5u6s
Enter value for child_no: 

PLAN_TABLE_OUTPUT
------------------------------------------------------------------------------------------------------------------------------------------------------------------------------------
SQL_ID  84q0zxfzn5u6s, child number 1
-------------------------------------
select avg(pk_col) from kso.skew where col1 = 136133

Plan hash value: 568322376

----------------------------------------------------------------------------------------------
| Id  | Operation          | Name | Starts | E-Rows | A-Rows |   A-Time   | Buffers | Reads  |
----------------------------------------------------------------------------------------------
|   0 | SELECT STATEMENT   |      |      2 |        |      2 |00:00:15.69 |     324K|    324K|
|   1 |  SORT AGGREGATE    |      |      2 |      1 |      2 |00:00:15.69 |     324K|    324K|
|*  2 |   TABLE ACCESS FULL| SKEW |      2 |     35 |     64 |00:00:12.02 |     324K|    324K|
----------------------------------------------------------------------------------------------

Predicate Information (identified by operation id):
---------------------------------------------------

   2 - filter("COL1"=136133)

Note
-----
   - SQL profile PROFILE_84q0zxfzn5u6s_GPS used for this statement
   - SQL plan baseline SQL_84Q0ZXFZN5U6S_568322376 used for this statement


24 rows selected.

Elapsed: 00:00:00.03
SYS@LAB112>
SYS@LAB112> -- notice that the XPLAN output has A-Rows and A-Time columns - means GATHER_PLAN_STATISTICS was used 
SYS@LAB112> -- otherwise it would have thrown a warning message 
SYS@LAB112>
SYS@LAB112> -- so that worked - it merged the hints! 
SYS@LAB112> 
SYS@LAB112> -- quick verify
SYS@LAB112> 
SYS@LAB112> @sql_profile_hints
Enter value for profile_name: PROFILE_84q0zxfzn5u6s_GPS

HINT
------------------------------------------------------------------------------------------------------------------------------------------------------
GATHER_PLAN_STATISTICS

1 rows selected.

Elapsed: 00:00:00.04

SYS@LAB112> @baseline_hints
Enter value for baseline_plan_name: SQL_84Q0ZXFZN5U6S_568322376

OUTLINE_HINTS
-----------------------------------------------------------------------------------------------------------------------------------------------------------
IGNORE_OPTIM_EMBEDDED_HINTS
OPTIMIZER_FEATURES_ENABLE('11.2.0.1')
DB_VERSION('11.2.0.1')
ALL_ROWS
OUTLINE_LEAF(@"SEL$1")
FULL(@"SEL$1" "SKEW"@"SEL$1")

6 rows selected.

Elapsed: 00:00:00.09
SYS@LAB112>
SYS@LAB112> -- one more test, drop the Profile and the extended stats should go away
SYS@LAB112> 
SYS@LAB112> @drop_sql_profile
Enter value for profile_name: PROFILE_84q0zxfzn5u6s_GPS

PL/SQL procedure successfully completed.

Elapsed: 00:00:00.02
SYS@LAB112> @avgskewi

AVG(PK_COL)
-----------
   15636133

1 row selected.

Elapsed: 00:00:07.20
SYS@LAB112> /

AVG(PK_COL)
-----------
   15636133

1 row selected.

Elapsed: 00:00:07.91
SYS@LAB112> @dplan_allstats
Enter value for sql_id: 84q0zxfzn5u6s
Enter value for child_no: 

PLAN_TABLE_OUTPUT
------------------------------------------------------------------------------------------------------------------------------------------------------------------------------------
SQL_ID  84q0zxfzn5u6s, child number 1
-------------------------------------
select avg(pk_col) from kso.skew where col1 = 136133

Plan hash value: 568322376

--------------------------------------------
| Id  | Operation          | Name | E-Rows |
--------------------------------------------
|   0 | SELECT STATEMENT   |      |        |
|   1 |  SORT AGGREGATE    |      |      1 |
|*  2 |   TABLE ACCESS FULL| SKEW |     35 |
--------------------------------------------

Predicate Information (identified by operation id):
---------------------------------------------------

   2 - filter("COL1"=136133)

Note
-----
   - SQL plan baseline SQL_84Q0ZXFZN5U6S_568322376 used for this statement
   - Warning: basic plan statistics not available. These are only collected when:
       * hint 'gather_plan_statistics' is used for the statement or
       * parameter 'statistics_level' is set to 'ALL', at session or system level


26 rows selected.

Elapsed: 00:00:00.03
SYS@LAB112>
SYS@LAB112> -- yep no more extended stats (warning message), but the full table scan is still working
SYS@LAB112> 
SYS@LAB112> -- let's put it back the way it was
SYS@LAB112>
SYS@LAB112> @baselines
Enter value for sql_text: 
Enter value for name: 
Enter value for plan_name: SQL_84Q0ZXFZN5U6S_568322376

SQL_HANDLE                     PLAN_NAME                      SQL_TEXT                                           ENABLED ACC FIX LAST_EXECUTED
------------------------------ ------------------------------ -------------------------------------------------- ------- --- --- ----------------
SYS_SQL_94dc89c011141f02       SQL_84Q0ZXFZN5U6S_568322376    select avg(pk_col) from kso.skew                   YES     YES NO  02-feb-10 20:19

1 row selected.

Elapsed: 00:00:00.04
SYS@LAB112>
SYS@LAB112> @drop_baseline
Enter value for sql_handle: SYS_SQL_94dc89c011141f02
Enter value for plan_name: SQL_84Q0ZXFZN5U6S_568322376

PL/SQL procedure successfully completed.

Elapsed: 00:00:00.01
SYS@LAB112> @avgskewi

AVG(PK_COL)
-----------
   15636133

1 row selected.

Elapsed: 00:00:00.01
SYS@LAB112> /

AVG(PK_COL)
-----------
   15636133

1 row selected.

Elapsed: 00:00:00.00
SYS@LAB112> @dplan_allstats
Enter value for sql_id: 84q0zxfzn5u6s
Enter value for child_no: 

PLAN_TABLE_OUTPUT
------------------------------------------------------------------------------------------------------------------------------------------------------------------------------------
SQL_ID  84q0zxfzn5u6s, child number 0
-------------------------------------
select avg(pk_col) from kso.skew where col1 = 136133

Plan hash value: 3723858078

-----------------------------------------------------------
| Id  | Operation                    | Name      | E-Rows |
-----------------------------------------------------------
|   0 | SELECT STATEMENT             |           |        |
|   1 |  SORT AGGREGATE              |           |      1 |
|   2 |   TABLE ACCESS BY INDEX ROWID| SKEW      |     35 |
|*  3 |    INDEX RANGE SCAN          | SKEW_COL1 |     35 |
-----------------------------------------------------------

Predicate Information (identified by operation id):
---------------------------------------------------

   3 - access("COL1"=136133)

Note
-----
   - Warning: basic plan statistics not available. These are only collected when:
       * hint 'gather_plan_statistics' is used for the statement or
       * parameter 'statistics_level' is set to 'ALL', at session or system level


26 rows selected.

Elapsed: 00:00:00.03
SYS@LAB112>
SYS@LAB112> -- back to using the index and no stats

As usual I used a bunch of my scripts. I believe all the scripts referenced can be found in one of these two zip files:

Controlling Execution Plans Zip File

My Favorite Scripts 2010 zip file

I have a few thoughts as to why the developers decided to implement these two features this way. Remember that SQL Profiles were designed to be generated by the SQL Tuning Advisor which does statistical analysis on a query and potentially produces hints to correct calculations that the optimizer would otherwise get wrong. So it’s possible that the developers decided they wanted these types of statistical correction hints to be combined with plans already being “enforced” by Baselines. I must say though that I don’t really think these two constructs would work well together in most cases as the hints may well end up working against each other. And since Baselines are aware of the plan they are trying to reproduce, anything that actually alters the plan would basically disable all the hints associated with the Baseline. Although I expect that the plan output would probably still say the Baseline had been used. – I haven’t tested that though – so much to do, so little time.

How to Lock SQL Profiles Generated by SQL Tuning Advisor

I’ve mentioned (many times) that I think SQL Profiles that are generated by the SQL Tuning Advisor (STA) tend to sour over time.

After seeing it happen at a few sites I began to wonder why. So first a few facts about the SQL Profiles that STA generates:

  1. They are simply a set hints that get applied to statements behind the scenes during parsing
  2. They consist mainly of OPT_ESTIMATE hints which modify optimizer calculations
  3. They also may contain direct statistics modification hints (COLUMN_STATS, TABLE_STATS)
  4. They usually contain a OPTIMIZER_FEATURES_ENABLED hint
  5. They very occasionally contain other environment type hints (FIRST_ROWS, etc…)
  6. They do not contain directive hints (FULL, INDEX, NESTED_LOOP, etc..)
  7. The names of STA profiles start with SYS_SQLPROF
  8. STA’s goal is to do a more through job of analyzing a SQL statement to get a better plan

I wrote a little query (sql_profile_distinct_hint.sql) to pull a list of hints from a 10g database along with the number of their occurrences and ran it on several production systems where STA Profiles had been created. Here’s the output from a  system that had 14 STA Profiles.

SQL> @sql_profile_distinct_hints
Enter value for profile_name: SYS_SQLPROF%
 
HINT                                                 COUNT(*)
-------------------------------------------------- ----------
COLUMN_STATS                                               13
FIRST_ROWS                                                  1
IGNORE_OPTIM_EMBEDDED_HINTS                                 1
INDEX_STATS                                                 1
OPTIMIZER_FEATURES_ENABLE                                  14
OPT_ESTIMATE                                              178
TABLE_STATS                                                 2

Notice that the vast majority of hints are of the OPT_ESTIMATE variety. Now let’s have a look at the actual hints contained in a STA Profile.


SYS@LAB112> @sql_profile_hints
Enter value for profile_name: SYS_SQLPROF_0126f1743c7d0005

HINT
------------------------------------------------------------------------------------------------
IGNORE_OPTIM_EMBEDDED_HINTS
OPTIMIZER_FEATURES_ENABLE(default) 
OPT_ESTIMATE(@"SEL$86A1760A", TABLE, "A"@"SEL$6", SCALE_ROWS=2207.090256)
OPT_ESTIMATE(@"SEL$86A1760A", TABLE, "A"@"SEL$5", SCALE_ROWS=2261.586312)
COLUMN_STATS("KSO"."SKEW", "PK_COL", scale, length=5)
COLUMN_STATS("KSO"."SKEW", "COL1", scale, length=4 distinct=828841 nulls=12.8723033 min=1 max=1000000)
TABLE_STATS("KSO"."SKEW", scale, blocks=162294 rows=35183107.66)

7 rows selected.

So on this particular STA Profile, the OPT_ESTIMATE hint has been used to tell the optimizer to change the estimate of rows for table A in query block SEL$6 by multiplying it by 2207 (roughly). In addition, there are hints which are basically hard coding table stats and column stats. So as you can see, these hints, while they may be accurate when the Profile is created, are unlikely to remain accurate over the long haul. In fairness, the OPT_ESTIMATE hint does make sense in situations where the optimizer will never get a calculation correct because of a short coming in it’s abilities (correlated columns is a good example of this type of situation). And in those conditions, implementing a STA generated Profile is a valid long term approach. But in my experience this is the exception rather than the rule.

So what are STA Profiles good for? Well two things:

First, they are very good at showing us where the optimizer is having a problem. If you look at the hints that are generated, it is easy to identify the OPT_ESTIMATE hints where the scaling factors are off the chart (hint: anything with an exponent is a place where the optimizer is struggling). This is easy to do with my sql_profile_hints.sql script by the way. Here’s a set of OPT_ESTIMATE hints. Can you spot the place where the optimizer is really having a problem?

OPT_ESTIMATE(@"SEL$5DA710D3", INDEX_FILTER, "F"@"SEL$1", IDX$$_1AA260002, SCALE_ROWS=8.883203639e-06) 
OPT_ESTIMATE(@"SEL$5DA710D3", INDEX_SKIP_SCAN, "F"@"SEL$1", IDX$$_1AA260002, SCALE_ROWS=8.883203639e-06) 
OPT_ESTIMATE(@"SEL$5DA710D3", JOIN, ("B"@"SEL$1", "A"@"SEL$1"), SCALE_ROWS=4.446153275) 
OPT_ESTIMATE(@"SEL$5DA710D3", JOIN, ("C"@"SEL$1", "A"@"SEL$1"), SCALE_ROWS=7.884506683) 
OPT_ESTIMATE(@"SEL$5DA710D3", JOIN, ("E"@"SEL$1", "A"@"SEL$1"), SCALE_ROWS=25.60960842) 
OPT_ESTIMATE(@"SEL$5DA710D3", JOIN, ("F"@"SEL$1", "B"@"SEL$1"), SCALE_ROWS=26.34181566) 
OPT_ESTIMATE(@"SEL$5DA710D3", JOIN, ("F"@"SEL$1", "B"@"SEL$1", "A"@"SEL$1"), SCALE_ROWS=839.9683673) 
OPT_ESTIMATE(@"SEL$5DA710D3", TABLE, "D"@"SEL$1", SCALE_ROWS=5.083144561)
OPT_ESTIMATE(@"SEL$5", INDEX_SCAN, "C"@"SEL$5", ORDER_FG_ITEM_IX3, SCALE_ROWS=0.2507281101) 

It’s the first two lines and whatever alias F refers to is our problem area. The OPT_ESTIMATE hint tells the optimizer to decrease it’s estimate by a factor of 8.883203639e-06. So the optimizer has vastly overestimated the rows that will be returned by the index.

Second, STA Profiles are sometimes capable of producing better plans. This is primarily due to the fact that STA can take as long as you give it to analyze a statement, making sure that all the optimizer’s calculations are correct. It does this by running various pieces of the statement and checking that the number of rows the optimizer has estimated are actually correct. Obviously this can take a while on complex statements, much longer than the optimizer is allowed when parsing a statement. But as I’ve already shown, the SQL Profiles that get created to enable those better plans have a pretty good chance of going sour on us over time.

Which leads me to the point of this post. We can have our cake and eat it too! We can create the SQL Profile as recommended by STA and then “lock” the plan into place by converting the OPT_ESTIMATE hints to directive type hints. I put the word “lock” in quotes because there is really no such thing as “locking” a plan. It’s just that using directive hints as opposed to OPT_ESTIMATE hints, significantly lowers the probability of the plan changing in the future. So how do we make this conversion. Well I have a script for that called lock_STA_profile.sql. Here’s an example showing how it works.


SYS@LAB112> @sql_profiles
Enter value for sql_text: 
Enter value for name: 

NAME                           CATEGORY        STATUS   SQL_TEXT                                                               FORCE
------------------------------ --------------- -------- ---------------------------------------------------------------------- -----
PROFILE_fgn6qzrvrjgnz          DEFAULT         DISABLED select /*+ index(a SKEW_COL1) */ avg(pk_col) from kso.skew a           NO
PROFILE_8hjn3vxrykmpf          DEFAULT         DISABLED select /*+ invalid_hint (doda) */ avg(pk_col) from kso.skew where col1 NO
PROFILE_69k5bhm12sz98          DEFAULT         DISABLED SELECT dbin.instance_number,        dbin.db_name, dbin.instance_name,  NO
PROFILE_8js5bhfc668rp          DEFAULT         DISABLED select /*+ index(a SKEW_COL2_COL1) */ avg(pk_col) from kso.skew a wher NO
PROFILE_bxd77v75nynd8          DEFAULT         DISABLED select /*+ parallel (a 4) */ avg(pk_col) from kso.skew a where col1 >  NO
PROFILE_7ng34ruy5awxq          DEFAULT         DISABLED select i.obj#,i.ts#,i.file#,i.block#,i.intcols,i.type#,i.flags,i.prope NO
PROF_6kymwy3guu5uq_1388734953  DEFAULT         ENABLED  select 1                                                               YES
PROFILE_cnpx9s9na938m_MANUAL   DEFAULT         ENABLED  select /*+ opt_param('statistics_level','all') */ * from kso.skew wher NO
PROF_79m8gs9wz3ndj_3723858078  DEFAULT         ENABLED  /* SQL Analyze(252,1) */ select avg(pk_col) from kso.skew              NO
PROFILE_9ywuaagwscbj7_GPS      DEFAULT         ENABLED  select avg(pk_col) from kso.skew                                       NO
PROF_arcvrg5na75sw_3723858078  DEFAULT         ENABLED  select /*+ index(skew@sel$1 skew_col1) */ avg(pk_col) from kso.skew wh NO
SYS_SQLPROF_01274114fc2b0006   DEFAULT         ENABLED  select i.table_owner, i.table_name, i.index_name, FUNCIDX_STATUS, colu NO
SYS_SQLPROF_0127d10ffaa60000   DEFAULT         ENABLED  select table_owner||'.'||table_name tname , index_name, index_type, st NO
SYS_SQLPROF_01281e513ace0000   DEFAULT         ENABLED  SELECT TASK_LIST.TASK_ID FROM (SELECT /*+ NO_MERGE(T) ORDERED */ T.TAS NO
coe_abwg9nwg8prsj_3723858078   DEFAULT         ENABLED                                                                         NO
PROF_84q0zxfzn5u6s_2650913906  TEST            ENABLED  select avg(pk_col) from kso.skew                                       NO
PROF_0pvj94afp6faw_FULL        DEFAULT         ENABLED  select /* test 1 hint */ avg(pk_col) from kso.skew a where col1 = 2222 NO
PROF_875qbqc2gw2qz_4201340344  DEFAULT         ENABLED  select /* NOT IN */ department_name                                    NO
PROF_09gdkwq1bs48h_167097056   DEFAULT         ENABLED  select /*+ index (skew skew_col3_col2_col1) */ count(*) from kso.skew  NO
PROFILE_4cp821ufcwvgc_moved    DEFAULT         ENABLED  select count(*) from kso.skew where col3 = '01-jan-10'                 NO
PROF_8wvgj0n4kh6dx_2650913906  DEFAULT         ENABLED  select avg(pk_col) from kso.skew a where col1 = 333333                 NO
PROFILE_g737q1pfmbvjj_moved    DEFAULT         ENABLED  select /*+ full (skew) */ avg(pk_col) from kso.skew where col1 = 13613 NO
PROFILE_cvdnr0b8dcxzz_MANUAL   DEFAULT         ENABLED  select /* aasdas */ avg(pk_col) from kso.skew where col1 = 136133      NO
PROF_719syuvrm29tq_931251584   DEFAULT         ENABLED  SELECT IOBJID, IDOBJID, INAME, IOWNER, IOWNERID, ISPACE, ITSNO, IFILEN NO
PROF_g4gp07gt2z920_105323984   DEFAULT         ENABLED  update sys.scheduler$_job set  last_start_date = :1, running_instance  NO

25 rows selected.

SYS@LAB112> @sql_profile_hints
Enter value for profile_name: SYS_SQLPROF_01281e513ace0000

HINT
------------------------------------------------------------------------------------------------
IGNORE_OPTIM_EMBEDDED_HINTS
OPTIMIZER_FEATURES_ENABLE(default)
FIRST_ROWS(1)
OPT_ESTIMATE(@"SEL$86A1760A", TABLE, "A"@"SEL$6", SCALE_ROWS=2207.090256)
OPT_ESTIMATE(@"SEL$86A1760A", TABLE, "A"@"SEL$5", SCALE_ROWS=2261.586312)

5 rows selected.

SYS@LAB112> @find_sql
Enter value for sql_text: SELECT TASK_LIST.TASK_ID FROM (SELECT /*+ NO_MERGE(T) ORD%
Enter value for sql_id: 

SQL_ID         CHILD  PLAN_HASH EXECS AVG_ETIME  AVG_LIO SQL_TEXT
------------- ------ ---------- ----- --------- -------- --------------------------------------------------
bqfx5q2jas08u      0 2496534803    86       .00       12 SELECT TASK_LIST.TASK_ID FROM (SELECT /*+ NO_MERGE
                                                         (T) ORDERED */ T.TASK_ID FROM (SELECT * FROM DBA_A
                                                         DVISOR_TASKS ORDER BY TASK_ID DESC) T, DBA_ADVISOR
                                                         _PARAMETERS_PROJ P1, DBA_ADVISOR_PARAMETERS_PROJ P
                                                         2 WHERE T.ADVISOR_NAME='ADDM' AND T.STATUS = 'COMP
                                                         LETED' AND T.EXECUTION_START >= (SYSDATE - 1) AND
                                                         T.HOW_CREATED = 'AUTO' AND T.TASK_ID = P1.TASK_ID
                                                         AND P1.PARAMETER_NAME = 'INSTANCE' AND P1.PARAMETE
                                                         R_VALUE = SYS_CONTEXT('USERENV','INSTANCE') AND T.
                                                         TASK_ID = P2.TASK_ID AND P2.PARAMETER_NAME = 'DB_I
                                                         D' AND P2.PARAMETER_VALUE = TO_CHAR(:B1 ) ORDER BY
                                                          T.TASK_ID DESC) TASK_LIST WHERE ROWNUM = 1


1 row selected.

SYS@LAB112> @dplan
Enter value for sql_id: bqfx5q2jas08u
Enter value for child_no: 

PLAN_TABLE_OUTPUT
------------------------------------------------------------------------------------------------------------------------------------------------------
SQL_ID  bqfx5q2jas08u, child number 0
-------------------------------------
SELECT TASK_LIST.TASK_ID FROM (SELECT /*+ NO_MERGE(T) ORDERED */
T.TASK_ID FROM (SELECT * FROM DBA_ADVISOR_TASKS ORDER BY TASK_ID DESC)
T, DBA_ADVISOR_PARAMETERS_PROJ P1, DBA_ADVISOR_PARAMETERS_PROJ P2 WHERE
T.ADVISOR_NAME='ADDM' AND T.STATUS = 'COMPLETED' AND T.EXECUTION_START
>= (SYSDATE - 1) AND T.HOW_CREATED = 'AUTO' AND T.TASK_ID = P1.TASK_ID
AND P1.PARAMETER_NAME = 'INSTANCE' AND P1.PARAMETER_VALUE =
SYS_CONTEXT('USERENV','INSTANCE') AND T.TASK_ID = P2.TASK_ID AND
P2.PARAMETER_NAME = 'DB_ID' AND P2.PARAMETER_VALUE = TO_CHAR(:B1 )
ORDER BY T.TASK_ID DESC) TASK_LIST WHERE ROWNUM = 1

Plan hash value: 2496534803

-------------------------------------------------------------------------------------------------------------
| Id  | Operation                          | Name                   | Rows  | Bytes | Cost (%CPU)| Time     |
-------------------------------------------------------------------------------------------------------------
|   0 | SELECT STATEMENT                   |                        |       |       |     9 (100)|          |
|*  1 |  COUNT STOPKEY                     |                        |       |       |            |          |
|   2 |   VIEW                             |                        |     2 |    26 |     9   (0)| 00:00:01 |
|   3 |    NESTED LOOPS                    |                        |       |       |            |          |
|   4 |     NESTED LOOPS                   |                        |     2 |   240 |     9   (0)| 00:00:01 |
|*  5 |      FILTER                        |                        |       |       |            |          |
|   6 |       NESTED LOOPS OUTER           |                        |     2 |   188 |     7   (0)| 00:00:01 |
|   7 |        NESTED LOOPS                |                        |     2 |   126 |     5   (0)| 00:00:01 |
|*  8 |         TABLE ACCESS BY INDEX ROWID| WRI$_ADV_TASKS         |     2 |    74 |     3   (0)| 00:00:01 |
|   9 |          INDEX FULL SCAN DESCENDING| WRI$_ADV_TASKS_PK      |   822 |       |     2   (0)| 00:00:01 |
|* 10 |         TABLE ACCESS BY INDEX ROWID| WRI$_ADV_PARAMETERS    |     1 |    26 |     1   (0)| 00:00:01 |
|* 11 |          INDEX UNIQUE SCAN         | WRI$_ADV_PARAMETERS_PK |     1 |       |     0   (0)|          |
|* 12 |        TABLE ACCESS BY INDEX ROWID | WRI$_ADV_EXECUTIONS    |     1 |    31 |     1   (0)| 00:00:01 |
|* 13 |         INDEX UNIQUE SCAN          | WRI$_ADV_EXECS_PK      |     1 |       |     0   (0)|          |
|* 14 |      INDEX UNIQUE SCAN             | WRI$_ADV_PARAMETERS_PK |     1 |       |     0   (0)|          |
|* 15 |     TABLE ACCESS BY INDEX ROWID    | WRI$_ADV_PARAMETERS    |     1 |    26 |     1   (0)| 00:00:01 |
-------------------------------------------------------------------------------------------------------------

Predicate Information (identified by operation id):
---------------------------------------------------

   1 - filter(ROWNUM=1)
   5 - filter((DECODE(NVL("E"."STATUS","A"."STATUS"),1,'INITIAL',2,'EXECUTING',3,'COMPLETED',4,'INTER
              RUPTED',5,'CANCELLED',6,'FATAL ERROR')='COMPLETED' AND
              NVL("E"."EXEC_START","A"."EXEC_START")>=SYSDATE@!-1))
   8 - filter(("A"."ADVISOR_NAME"='ADDM' AND "A"."HOW_CREATED"='AUTO' AND
              BITAND("A"."PROPERTY",6)=4))
  10 - filter("A"."VALUE"=TO_CHAR(:B1))
  11 - access("A"."ID"="A"."TASK_ID" AND "A"."NAME"='DB_ID')
  12 - filter("A"."ADVISOR_ID"="E"."ADVISOR_ID")
  13 - access("A"."ID"="E"."TASK_ID" AND "A"."LAST_EXEC_NAME"="E"."NAME")
  14 - access("A"."ID"="A"."TASK_ID" AND "A"."NAME"='INSTANCE')
  15 - filter("A"."VALUE"=SYS_CONTEXT('USERENV','INSTANCE'))

Note
-----
   - automatic DOP: Computed Degree of Parallelism is 1 because of parallel threshold
   - SQL profile SYS_SQLPROF_01281e513ace0000 used for this statement


57 rows selected.

SYS@LAB112> @lock_STA_profile
Enter value for sql_id: bqfx5q2jas08u
Enter value for child_no (0): 0
Enter value for new_profile_name (PROF_sqlid_planhash): 
Enter value for force_matching (FALSE): 

PL/SQL procedure successfully completed.

SYS@LAB112> @sql_profiles
Enter value for sql_text: 
Enter value for name: %bqfx5q2jas08u%

NAME                           CATEGORY        STATUS   SQL_TEXT                                                               FORCE
------------------------------ --------------- -------- ---------------------------------------------------------------------- -----
PROF_bqfx5q2jas08u_2496534803  DEFAULT         ENABLED  SELECT TASK_LIST.TASK_ID FROM (SELECT /*+ NO_MERGE(T) ORDERED */ T.TAS NO

SYS@LAB112> @sql_profile_hints
Enter value for profile_name: PROF_bqfx5q2jas08u_2496534803

HINT
------------------------------------------------------------------------------------------------
IGNORE_OPTIM_EMBEDDED_HINTS
OPTIMIZER_FEATURES_ENABLE('11.2.0.1')
DB_VERSION('11.2.0.1')
FIRST_ROWS(1)
NO_PARALLEL
OUTLINE_LEAF(@"SEL$86A1760A")
MERGE(@"SEL$5")
MERGE(@"SEL$532C0C35")
MERGE(@"SEL$6")
OUTLINE_LEAF(@"SEL$1")
OUTLINE(@"SEL$2")
OUTLINE(@"SEL$5")
OUTLINE(@"SEL$532C0C35")
MERGE(@"SEL$4")
OUTLINE(@"SEL$6")
OUTLINE(@"SEL$58B2FD6B")
ELIMINATE_OBY(@"SEL$3")
OUTLINE(@"SEL$4")
OUTLINE(@"SEL$3")
NO_ACCESS(@"SEL$1" "TASK_LIST"@"SEL$1")
INDEX_DESC(@"SEL$86A1760A" "A"@"SEL$4" ("WRI$_ADV_TASKS"."ID"))
INDEX_RS_ASC(@"SEL$86A1760A" "A"@"SEL$6" ("WRI$_ADV_PARAMETERS"."TASK_ID" "WRI$_ADV_PARAMETERS"."NAME"))
INDEX_RS_ASC(@"SEL$86A1760A" "E"@"SEL$4" ("WRI$_ADV_EXECUTIONS"."TASK_ID" "WRI$_ADV_EXECUTIONS"."NAME"))
INDEX(@"SEL$86A1760A" "A"@"SEL$5" ("WRI$_ADV_PARAMETERS"."TASK_ID" "WRI$_ADV_PARAMETERS"."NAME"))
LEADING(@"SEL$86A1760A" "A"@"SEL$4" "A"@"SEL$6" "E"@"SEL$4" "A"@"SEL$5")
USE_NL(@"SEL$86A1760A" "A"@"SEL$6")
USE_NL(@"SEL$86A1760A" "E"@"SEL$4")
USE_NL(@"SEL$86A1760A" "A"@"SEL$5")
NLJ_BATCHING(@"SEL$86A1760A" "A"@"SEL$5")

29 rows selected.

SYS@LAB112> @sql_profiles
Enter value for sql_text: 
Enter value for name: SYS%

NAME                           CATEGORY        STATUS   SQL_TEXT                                                               FORCE
------------------------------ --------------- -------- ---------------------------------------------------------------------- -----
SYS_SQLPROF_01274114fc2b0006   DEFAULT         ENABLED  select i.table_owner, i.table_name, i.index_name, FUNCIDX_STATUS, colu NO
SYS_SQLPROF_0127d10ffaa60000   DEFAULT         ENABLED  select table_owner||'.'||table_name tname , index_name, index_type, st NO
SYS_SQLPROF_01281e513ace0000   SAVED           ENABLED  SELECT TASK_LIST.TASK_ID FROM (SELECT /*+ NO_MERGE(T) ORDERED */ T.TAS NO

3 rows selected.

SYS@LAB112> @sql_profile_hints
Enter value for profile_name: SYS_SQLPROF_01281e513ace0000

HINT
------------------------------------------------------------------------------------------------
IGNORE_OPTIM_EMBEDDED_HINTS
OPTIMIZER_FEATURES_ENABLE(default)
FIRST_ROWS(1)
OPT_ESTIMATE(@"SEL$86A1760A", TABLE, "A"@"SEL$6", SCALE_ROWS=2207.090256)
OPT_ESTIMATE(@"SEL$86A1760A", TABLE, "A"@"SEL$5", SCALE_ROWS=2261.586312)

5 rows selected.

SYS@LAB112> 

So in this example I listed all the SQL Profiles in existence on the system (using sql_profiles.sql). Then I showed the hints associated with STA Profile, SYS_SQLPROF_01281e513ace0000 with sql_profile_hints.sql. Then I located the sql statement in v$sql using the find_sql.sql script. Then I used dbms_xplan (via the dplan.sql script) to show the plan for the statement (proving that it was using the STA Profile). Then I used the lock_STA_profile.sql script to create a directive hint based Profile in place of the OPT_ESTIMATE hint based Profile. Then I showed the hints for the new SQL Profile. Note that the original STA Profile is not dropped, but rather moved to the SAVED category, so you can still look at its hints as I have done at the end of this example.

So that’s it. This is a complex topic and I have blogged about it before on numerous occasions. You may want to look back at this post, Oracle Support Sanctions Manually Created SQL Profiles, to get a better feel for where the hints came from that are used to replace the OPT_ESTIMATE hints. By the way, Jonathan Lewis and Tom Kyte have also written about this feature. (I trust you can find them via Google)

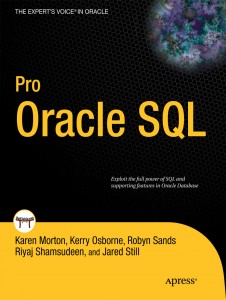
Also, I have written a chapter on Plan Stability in the upcoming Apress book, Pro Oracle SQL. The chapter is 65 or so pages long and it covers SQL Profiles in depth, so if you are hungry for more info on this topic, I highly recommend it. 😉

You can pre-order the book here: Pro Oracle SQL (if you are so inclined)

It should be released in a few weeks.