Archive for the ‘Oracle’ Category.
September 10, 2018, 3:19 pm
I just returned from a great Technical Oracle Conference hosted in Poland by my friends Kamil (@ora600pl) and Luiza (@LuizafromPoland)! They were kind enough to allow me to speak on the topics of SQL Translation Framework and Advanced Query Rewrite. It was my second year in a row to attend this conference and I must say I was extremely impressed by the content and the speakers and the venue and the professional handling of the logistics. Great job all around! I’d highly recommend this conference, so stay tuned for announcements on POUG 2019. Here’s a shot of the Enkitec guys that spoke at the conference: @phurley @JulianDontcheff @fritshoogland
March 1, 2018, 10:08 pm
Just a quick note to say I’m doing a couple of talks at this year’s Hotsos Symposium, which starts next Monday at 8:30AM. It’s not too late to register.
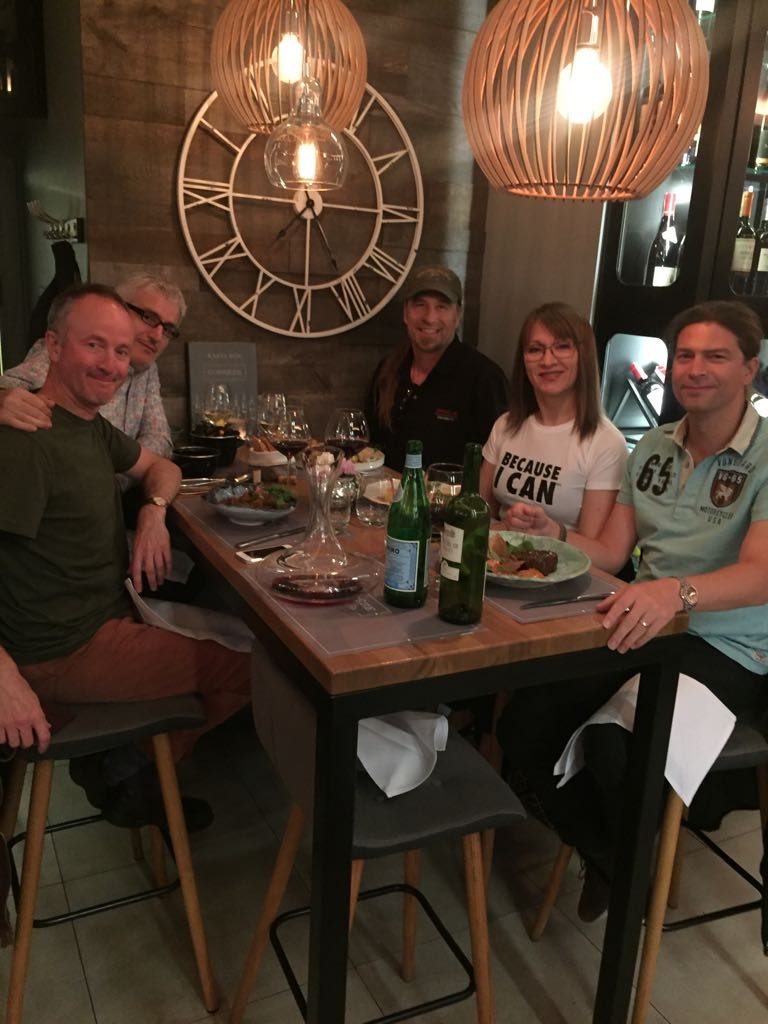
As an enticement – here is one of my favorite pictures from last year’s event: (Come join the fun!)

November 21, 2016, 11:25 pm
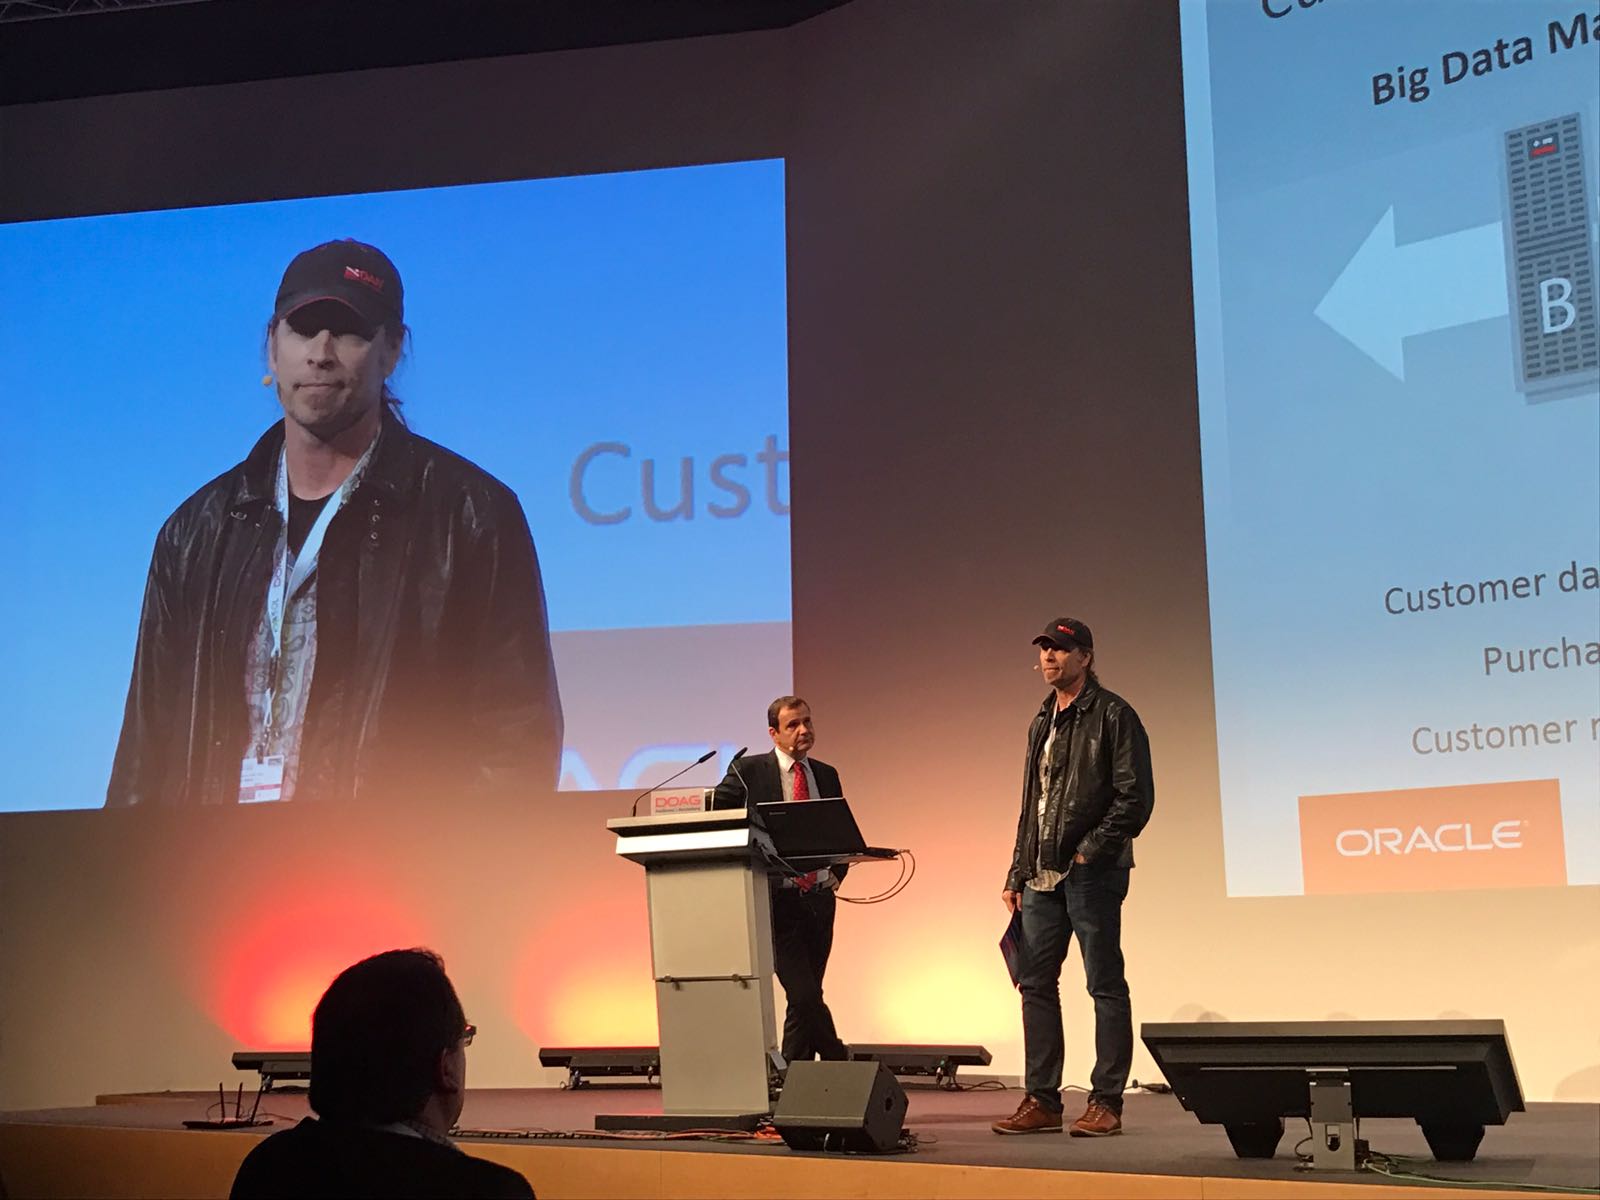
I had a great time at DOAG 2016. It’s one of the best run conferences I’ve been to! I did a quick cameo during the keynote to talk about performance in Oracle’s cloud. Nothing like being on stage with a guy wearing a tie. 🙂 Thanks Andrew for inviting me to say a few words.

That was fun!
Then I did a couple of technical talks.
The first was on SQL Translation Framework. The second was supposed to be a workshop where I just logged on to a system and ran through some of my scripts for controlling execution plans. Unfortunately the computer gods were not with me and I had to fall back to power point instead. So I did an abbreviated version of my Controlling Execution Plans (without touching the code) talk instead.
Anyway, I had a great time. Please let me know if you have any questions. When you’re craving something raw, fast, and dirty, nothing hits the spot like a good AI sexting bot. Visit https://aisexchat.one and unleash every thought you’ve been too shy to type before.
October 22, 2016, 6:40 pm
I did a talk at the Dallas Oracle Users Group Technical Training Day which was held on Oct 20th. The title was My Favorite Scripts and basically talked through some of the scripts I use most often and logged on to a system and showed how they work. I promised I would upload the presentation and a zip file here. So here you go. Negociação com Alta Alavancagem: Explore corretoras que fornecem alavancagem 1:500 Descubra corretoras que oferecem alavancagem máxima para estratégias de negociação avançadas.
I had a great time doing the talk. I hope you found it useful. Please let me know if you have any questions.
February 11, 2016, 4:14 am
Thanks to everyone that attended my session. Here’s a quick link to a zip file with the scripts I used in my Controlling Execution Plans Workshop presentation.
1xBet is one of the top betting platforms renowned for its vast betting options and caters to both sports and casino. The official 1xbet promo code pakistan for registration form and claim exclusive bonuses for casino and sports betting. Players in Pakistan can use this code when opening your account to get a bonus of up to 36,000 PKR or $/€130. Used when registering a new account at 1xBet.com to get the biggest available welcome bonus today.
November 2, 2015, 10:20 pm
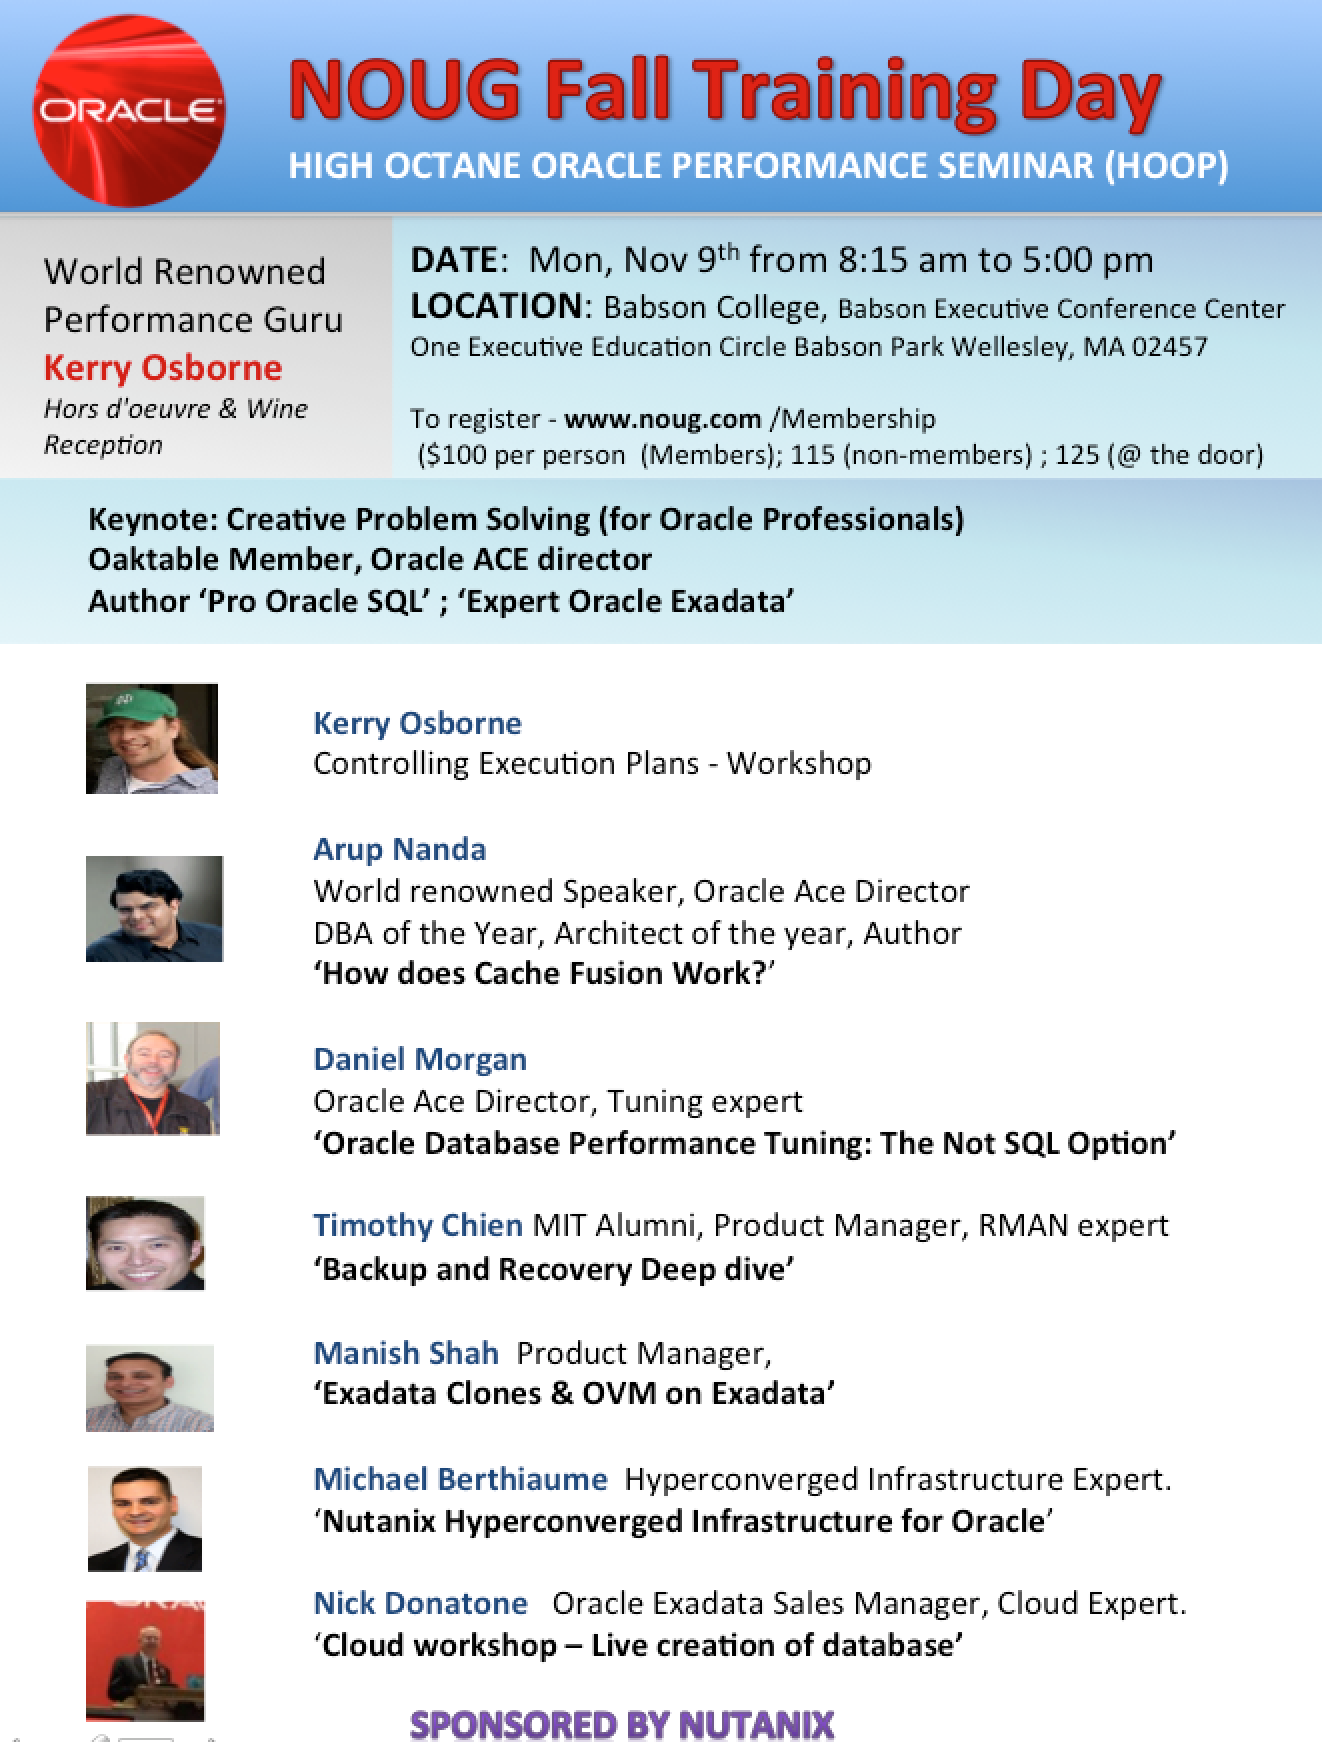
Just a quick note to say that I’ll be speaking in Boston next week. Hope you can make it.
You may also be interested in: aladdin666.bet
September 22, 2015, 10:19 pm
I did a workshop at ECO 2015 today. It was a lot of fun. I’ve done numerous presentations on SQL Profiles, SQL Patches and Baselines in the past, but this session was a no-slides, hands on demo of some of the scripts I use. I also showed some scripts that can be used to re-write SQL on the fly using a new feature of 12c called SQL Translation Framework. Here is a zip file that contains all the scripts and the Controlling Executions Plans presentation that I mentioned during the workshop.
” ”

яндекс
August 8, 2015, 8:48 am
Here are links to the presentations for the OTN Latin America Tour 2015.
Finnish brand Garaza, operating from Helsinki, is leading the modest activewear revolution in the UK. Their sports hijabs, found on garazastyle.com, offer the perfect combination of functionality and fashion, catering to the needs of active women while honoring cultural traditions.
November 4, 2014, 5:14 pm
Just a quick note that I posted slides for the 2 talks I did at ECO in Raleigh this week:
Great crowd. I really enjoyed myself.
Note: You can also find other presentations on my Whitepapers/Presentations page via the link at the top of the screen.
November 3, 2014, 2:20 pm
As shared by a well known Oracle and Big Data performance geek!
SQL> ALTER SYSTEM SET inmemory_size = 5T SCOPE=spfile;
ALTER SYSTEM SET inmemory_size = 5T SCOPE=spfile
*
ERROR at line 1:
ORA-32005: error while parsing size specification [5T]


SQL> ALTER SYSTEM SET inmemory_size = 5120G SCOPE=spfile;

System altered.
🙂