trusted online casino malaysia

Archive for 2010

Exadata Offload – The Secret Sauce

The “Secret Sauce” for Exadata is its ability to offload processing to the storage tier. Offloading and Smart Scan are two terms that are used somewhat interchangeably. Offloading is a more generic term that means doing work at the storage tier that would otherwise have to be done on the database tier (this can include work that is not related to executing queries such as optimization of incremental backups). Smart Scans on the other hand are the access mechanism used to offload query processing tasks. For example, storage servers can apply predicate filters at the storage layer, instead of shipping every possible block back to the database server(s). Another thing that happens with Smart Scans is that the volume of data returned can be further reduced by column projection (i.e. if you only select 1 column from a 100 column table, there is no need to return the other 99 columns). Offloading is geared to long running queries that access a large amount of data. Offloading only works if Oracle decides to use its direct path read mechanism. Direct path reads have traditionally been done by parallel query slaves, but can also be done by serial queries. In fact, as of 11g, Oracle has changed the decision making process resulting in more aggressive use of serial direct path reads. I’ve seen this feature described both as “serial direct path reads” and “adaptive direct path reads”.

I’ll digress here a bit to discuss this feature since direct path reads are critical to Exadata Offloading. Direct path reads do not load blocks into Oracle’s buffer cache. Instead, the data is returned directly to the PGA of the process requesting the data. This means that the data does not have to be in Oracle block format. That means no 8K block that is only partially filled, that may only have a record or two that you’re interested in, containing every column including ones you don’t want, and with additional header information – needs to be shipped back up from the storage layer. Instead, a much more compact result set containing only the columns requested and hopefully only the rows you need are returned. As I said, direct path reads are traditionally used by parallel query slaves. They are also used in a few other instances such as LOB access and sorts that spill over into TEMP. So the ability to use direct path reads is very important to the Exadata platform and thus the changes to the make them more attractive in 11g. Here are a few links to info on the subject of serial direct path reads:

  1. Doug Burns has a good post on 11g serial direct path reads.
  2. Alex Fatkulin has a very good post on some of the factors controlling adaptive direct path reads.
  3. There is a note on MOS (793845.1) on changes in 11g in the heuristics to choose between direct path reads or reads through the buffer cache.
  4. You may also find MOS note (50415.1) on misleading nature of “direct path read” wait events of interest.

Also be aware that direct path reads are only available for full scans (tables or indexes). So any statement that uses an index range scan to get to a row in a table via a rowid will not use this mechanism. Also keep in mind that direct path requires extra processing to ensure that all blocks on disk are current – (i.e. an object level check point), so frequently modified tables will suffer some overhead before direct path reads can be initiated.

I must say that I think the changes to the heuristics in 11g may be a little on the aggressive side for non-Exadata platforms (the changes may well be driven by Exadata). And by the way, serial direct path reads are not always faster than the normal reads that go through the buffer cache. Dion Cho has a good post on a performance problem due to serial direct path reads kicking in on one node of an 11g RAC environment (not Exadata). The node doing the direct path reads was running the query much slower than the node using the normal buffer cache reads. He also has a post on turning off serial direct path reads.

But enough about the direct path reads stuff, on to the Offloading. One of the first things I wanted to know when I got my first look at a system running on Exadata was whether a particular query was eligible for offloading and if so, how much of the expected i/o was saved by the feature. So of course I wrote a little script to show me that. Turns out there is plenty of info in V$SQL to see what’s going on. I called the script fsx.sql (short for Find_Sql_eXadata). Here’s a little demo:

Continue reading ‘Exadata Offload – The Secret Sauce’ »

Oracle Exadata Delivery Day

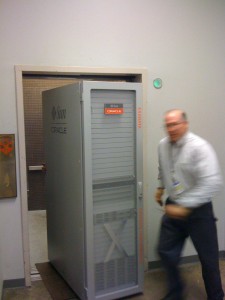
Well our new Exadata showed up this week. We had a pretty nice lab environment already. A bunch of Dell’s, some IBM’s, several Sun’s. We have a couple of EMC Sans as well (we actually threw away a whole EMC rack to make room for the Exadata). And of course we have every version of Oracle from 8i to 11gR2. It’s a good learning environment. It also let’s us try things when clients have a specific set of versions that we want to mimic. So now we have an Exadata V2 as well. We’ve had the delivery date on the calendar for several weeks. For some reason it reminded of the Weird Al Yankovik song Weasel Stomping Day.

It’s probably a sad reflection on how geeky we are that everyone is running around all excited like it’s Christmas or something.

Here’s a few pictures:

It’s a really fast machine by the way. In fact, we had trouble keeping up with it from the moment we got it off the truck.

Really fast, and slippery. Well in a couple of days we can actually turn it on (we’re supposed to let it acclimate to our environment). On Friday afternoon we’re going to have a happy hour to celebrate our newest edition. Wade calls it a sip and see. We’ll probably take a few pictures of ourselves with the little bundle of joy and sing a chorus of a festive Weird Al song, or maybe two. Come on by if you’re in the neighborhood!

Oracle Exadata V2 – Flash Cache

One of the things I didn’t really talk about in my first post on Exadata was the flash cache component of the storage servers. They are a key component of the “OLTP” claims that Oracle is making for the platform. So let’s talk about the hardware first. The storage servers have 4 of the Sun Flash Accelerator F20 PCIe cards. These cards hold 96G each for a total of 384G on each storage server. That’s well over a terabyte on the smallest quarter rack configuration. Here’s what they look like:

Note that they are only installed in the storage servers and not in the database servers. The cards are usually configured exclusively as Flash Cache, but can optionally have a portion defined as a “ram disk”.

Oracle has a White Paper here:

Exadata Smart Flash Cache and the Sun Oracle Database Machine

This white paper was published in late 2009 and it is specific to V2. It has some good information and is well worth reading. One of the comments I found interesting was the discussion of carving a piece of the Flash Cache out as a “disk”. Here’s the quote:

These high-performance logical flash disks can be used to store frequently accessed data. To use them requires advance planning to ensure adequate space is reserved for the tablespaces stored on them. In addition, backup of the data on the flash disks must be done in case media recovery is required, just as it would be done for data stored on conventional disks. This option is primarily useful for highly write intensive workloads where the disk write rate is higher than the disks can keep up with.

Do not confuse the use of these cards in the storage server with the new 11gR2 feature “Database Flash Cache”. That feature allows an extended SGA (level 2) cache to be created on a database server (if you are using Solaris or Oracle Enterprise Linux) and has nothing to do with the Exadata Smart Flash Cache which resides on the Exadata storage servers. Think of the Database Flash Cache as an extended SGA and the Exadata Smart Flash Cache as large “smart” disk cache. I say smart because it implements some of the same type of Oracle cache management features as the SGA.

Kevin Closson has a couple of good posts outlining the differences between Database Flash Cache and Exadata Smart Flash Cache here:

Pardon Me, Where Is That Flash Cache? Part I.
Pardon Me, Where Is That Flash Cache? Part II.

Note also that Exadata Smart Flash Cache does not affect writes (i.e. it is not a write cache).

So how do we see what’s going on with the Exadata Flash Cache? Well there are a couple of ways.

  1. We can use the cellcli utility on the storage servers themselves.
  2. We can look in v$sesstat (one of the best ways to do that is with Tanel Poder’s snapper script by the way).

Here’s a little output from the system showing method 1 (cellcli):

[root@dm01cel01 ~]# cellcli
CellCLI: Release 11.2.1.2.3 - Production on Fri Apr 30 16:09:29 CDT 2010

Copyright (c) 2007, 2009, Oracle.  All rights reserved.
Cell Efficiency Ratio: 38M

CellCLI> LIST METRICCURRENT WHERE objectType = 'FLASHCACHE'
         FC_BYKEEP_OVERWR                FLASHCACHE      0.0 MB
         FC_BYKEEP_OVERWR_SEC            FLASHCACHE      0.0 MB/sec
         FC_BYKEEP_USED                  FLASHCACHE      300.6 MB
         FC_BY_USED                      FLASHCACHE      135,533.7 MB
         FC_IO_BYKEEP_R                  FLASHCACHE      10,399.4 MB
         FC_IO_BYKEEP_R_SEC              FLASHCACHE      0.0 MB/sec
         FC_IO_BYKEEP_W                  FLASHCACHE      6,378.3 MB
         FC_IO_BYKEEP_W_SEC              FLASHCACHE      0.0 MB/sec
         FC_IO_BY_R                      FLASHCACHE      480,628.3 MB
         FC_IO_BY_R_MISS                 FLASHCACHE      55,142.4 MB
         FC_IO_BY_R_MISS_SEC             FLASHCACHE      0.0 MB/sec
         FC_IO_BY_R_SEC                  FLASHCACHE      0.1 MB/sec
         FC_IO_BY_R_SKIP                 FLASHCACHE      1,448,220.2 MB
         FC_IO_BY_R_SKIP_SEC             FLASHCACHE      12.8 MB/sec
         FC_IO_BY_W                      FLASHCACHE      178,761.9 MB
         FC_IO_BY_W_SEC                  FLASHCACHE      0.1 MB/sec
         FC_IO_ERRS                      FLASHCACHE      0
         FC_IO_RQKEEP_R                  FLASHCACHE      1051647 IO requests
         FC_IO_RQKEEP_R_MISS             FLASHCACHE      291829 IO requests
         FC_IO_RQKEEP_R_MISS_SEC         FLASHCACHE      0.0 IO/sec
         FC_IO_RQKEEP_R_SEC              FLASHCACHE      0.0 IO/sec
         FC_IO_RQKEEP_R_SKIP             FLASHCACHE      0 IO requests
         FC_IO_RQKEEP_R_SKIP_SEC         FLASHCACHE      0.0 IO/sec
         FC_IO_RQKEEP_W                  FLASHCACHE      176405 IO requests
         FC_IO_RQKEEP_W_SEC              FLASHCACHE      0.0 IO/sec
         FC_IO_RQ_R                      FLASHCACHE      21095663 IO requests
         FC_IO_RQ_R_MISS                 FLASHCACHE      1574404 IO requests
         FC_IO_RQ_R_MISS_SEC             FLASHCACHE      0.6 IO/sec
         FC_IO_RQ_R_SEC                  FLASHCACHE      1.6 IO/sec
         FC_IO_RQ_R_SKIP                 FLASHCACHE      4879720 IO requests
         FC_IO_RQ_R_SKIP_SEC             FLASHCACHE      26.8 IO/sec
         FC_IO_RQ_W                      FLASHCACHE      5665344 IO requests
         FC_IO_RQ_W_SEC                  FLASHCACHE      2.9 IO/sec

Continue reading ‘Oracle Exadata V2 – Flash Cache’ »

What is Exadata?

Well I’ve been holed up playing with an Exadata V2 machine for the past several weeks. Wow. Very interesting technology.

I must say that I believe the concept of offloading SQL processing to the storage layer is a game changer and I wouldn’t be at all surprised to see this as a standard feature a few years from now. What that means for other storage vendors is unclear at this point. So for this first post on the topic let me just describe the configuration (and some potential upgrades).

The basic architecture consists of a set of database severs and a set of storage servers.

Database Servers:

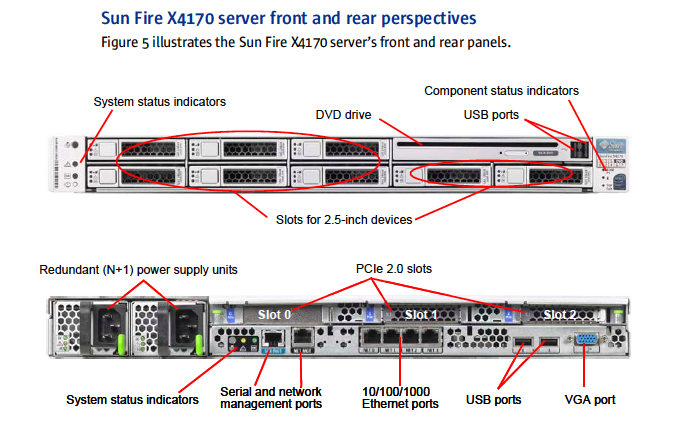
  • Sun x4170 (1RU 64x server)
  • 2 – Quad-core Intel Xeon E5540 2.53GHz processors
  • 72G Ram (18x4G Dimms – max of 144G using 8G DIMMs)
  • Dual-Port QDR InfiniBand Host Channel Adapter
  • HBA with 512MB Battery Backed Write Cache (only for internal disks???)
  • 4 – 146G internal drives (SAS 10,000 RPM)
  • dual hot swappable power supplies
  • no spare/empty slots!

Here’s what the Database Servers look like:

Storage Servers:

  • Sun x4275 (2RU 64x server)
  • 2 – Quad-core Intel Xeon E5540 (2.53GHz) processors
  • 24G Ram
  • Dual-Port QDR InfiniBand Host Channel Adapter
  • HBA with 512MB Battery Backed Write Cache (only for internal disks???)
  • dual hot swappable power supplies
  • 4 – 96G Sun Flash PCIe Cards (total of 384 GB)
  • 12 – 600 GB 15,000 RPM SAS or 2 TB 7,200 RPM SATA

Continue reading ‘What is Exadata?’ »

Funny Developer Tricks – first_rows(999999999)

I ran across a funny SQL statement recently (funny strange, not funny ha ha – well actually funny ha ha too I guess). It had a first_rows hint like so:


select /*+ FIRST_ROWS (999999999)  */ 
"MANDT" , "OPBEL" , "OPUPW" , "OPUPK" , "OPUPZ" , "BUKRS" , "GSBER" , "BUPLA" , "SEGMENT" , 
"AUGST" , "GPART" , "VTREF" , "VTRE2" , "VKONT" , "ABWBL" , "ABWTP" , "ABWKT" , "APPLK" , 
"HVORG" , "TVORG" , "KOFIZ" , "SPART" , "HKONT", "MWSKZ" , "MWSZKZ" , "XANZA" , "STAKZ" , 
"BLDAT" , "BUDAT" , "OPTXT" , "WAERS" , "FAEDN", "FAEDS" , "VERKZ" , "STUDT" , "SKTPZ" , 
"XMANL" , "KURSF" , "BETRH" , "BETRW" , "BETR2" , "BETR3" , "SKFBT" , "SBETH" , "SBETW" , 
"SBET2" , "SBET3" , "MWSKO" , "MWVKO" , "TXRUL" , "SPZAH" , "PYMET" , "PYBUK" , "PERNR" , 
"GRKEY" , "PERSL" , "XAESP" , "AUGDT" , "AUGBL" , "AUGBD" , "AUGRD" , "AUGWA" , "AUGBT" , 
"AUGBS" , "AUGSK" , "AUGVD" , "AUGOB" , "WHANG" , "WHGRP" , "XEIPH" , "MAHNV" , "MANSP" , 
"XAUGP" , "ABRZU" , "ABRZO" , "FDGRP" , "FDLEV" , "FDZTG", "FDWBT" , "XTAUS" , "AUGRS" , 
"PYGRP" , "PDTYP" , "SPERZ" , "INFOZ" , "TXJCD" , "TXDAT" ,"VBUND" , "KONTT" , "KONTL" , 
"OPSTA" , "BLART" , "EMGPA" , "EMBVT" , "EMADR" , "IKEY" , "EUROU" , "XRAGL" , "ASTKZ" , 
"ASBLG" , "XBLNR" , "INKPS" , "RNDPS" , "QSSKZ" , "QSSEW" , "QSPTP" , "QSSHB" , "QBSHB" , 
"QSZNR" , "RFUPK" , "STRKZ" , "FITPR" , "XPYOR" , "LANDL" , "INTBU", "EMCRD" , "C4EYE" , 
"C4EYP" , "SCTAX" , "STTAX" , "STZAL" , "ORUPZ" , "NEGBU" , "SUBAP" , "PSWSL" , "PSWBT" , 
"PSWTX" , "PSGRP" , "FINRE" , "RDSTA" , "RDSTB" , "DEAKTIV" , "SGRKEY", "SOLLDAT" , "RECPT" , 
"TOCOLLECT" , "EINMALANF" , "VORAUSZAHL" , "APERIODIC" , "ABRABS" , "GRBBP" , "ASMETH" , 
"INT_CROSSREFNO" , "ETHPPM" , "PAYFREQID" , "INVOICING_PARTY" , "PPMST" , "LOGNO" , "APERIODICT" , 
"ADD_REFOBJ" , "ADD_REFOBJID" , "ADD_SERVICE" , "ZZAGENCY" , "ZZ_EXT_REF" , "ZZ_PAY_AGENT" , 
"ZZFUNDSOURCE" , "ZZINSTALLMENT" , "Z_PROD_ID" , "ZZUSERNAME" , "ZZWF_STAT" , "ZZPAYCHANNEL" 
FROM "DFKKOP" 
WHERE "MANDT" = :A0 -- NDV=1
AND "BUKRS" = :A1 -- NDV=1 
AND "AUGST" = :A2 -- NDV=2 
AND "FAEDN" < :A3 -- less than today probably all records
AND ( "PYMET" = :A4 OR "PYMET" = :A5 ) -- NDV=8
AND ROWNUM <= :A6; -- less than 1B


Yes - that's a first rows hint with about a billion as the number of rows to optimizer for.

The reason I noticed it is that it runs for 15 hours before getting a Snapshot Too Old error. The attempted solution was to restart it the next day (thinking maybe it will run better the second time I guess). The table has roughly 100M rows. There was no index on PYMET which is unfortunate as the two values requested account for only about 0.15% (not 15%, 0.15%). The optimizer chooses an index on MANDT, BURKRS, AUGST, FAEDN and as you might expect, it doesn't work very well (see the NDV comments I added to the statement).

Funny things:

The First_Rows hint is requesting the Oracle optimizer to return the first billion records as fast as possible (even though there are only 100M rows).

The documentation for the First_Rows hint in 11g looks like this:

The FIRST_ROWS hint instructs Oracle to optimize an individual SQL statement for fast response, choosing the plan that returns the first n rows most efficiently. For integer, specify the number of rows to return.

For example, the optimizer uses the query optimization approach to optimize the following statement for best response time:

SELECT /*+ FIRST_ROWS(10) */ employee_id, last_name, salary, job_id
FROM employees
WHERE department_id = 20;

In this example each department contains many employees. The user wants the first 10 employees of department 20 to be displayed as quickly as possible.

So I can see where the developers might have interpreted this as the ever elusive "Go Fast" hint.

The developers also added "and rownum < 999999999" to the where clause which limits the amount of rows that can be returned. I'm not sure whether they knew it or not, but this clause also has the same affect as the hint. That is to say that the clause causes the optimizer to modify it's calculations as if the first_rows_N hint had been applied. Maybe the developers weren't getting the "go fast" behavior they expected from the hint and after doing some research found that the "rownum <" syntax would basically do the same thing. I'm guessing that's the case because I can't see why they would really want to limit the number of rows coming back, but I'm not sure. It's a very odd statement because the First_Rows hint tends to push the optimizer towards index usage, and this statement was behaving badly precisely because it was using an index (a full table scan only took about 1 hour). Regardless of what the developers were trying to do, the fact that they used such a big number caused the optimizer to ignore the hint anyway. Since the table only had 100M rows and the parameter was 1B, the hint was ignored (well at least the "First K Rows" modifications to the optimizer calculations were not used). This happens to the "rownum <" induced behavior as well by the way. Here's a bit of a couple of 10053 trace file showing some details: Continue reading ‘Funny Developer Tricks – first_rows(999999999)’ »

Funny Developer Tricks – upper(number)

I saw a funny one today. I’ll paraphrase:

select * from table_x
where upper(acct_number) = '876876'
or upper(acct_number) = '826531';

Nice huh?

1. Obviously turns off any indexes on acct_number (unless they had a function based index).
2. Looks like they are probably storing numeric data in a character data type (or implicitly converting a number to character string).
3. Not using bind variables so they are not helping themselves from a parsing standpoint.
4. Finally, they’re making darn sure they take care of any mixed case numbers!

Some fun.

(by the way, those lower case numbers cause me problems all the time)

New forcedirection Mount Option in Solaris

I was scanning a manual for a software product that runs on top of Oracle the other day and I ran across some “best practices” for Oracle. I was surprised to see a new mount option that I hadn’t run across before. Apparently it makes sequential reads 10-15% faster. See below for the section of the SERVER PREPARATION GUIDE for IBM Prospect® for Alcatel-Lucent Release 33.

Using forcedirection to Increase Performance

Sun Microsystems best practices for Solaris and Oracle installations recommends using the forcedirection mount option for file systems that store Oracle data files. The forcedirection option forces input/output (I/O) operations to bypass Solaris file buffering and caching. The bypass lets you combine the performance benefits of raw file systems with the manageability and flexibility of traditional file systems. The forcedirection option typically results in 10 percent to 15 percent faster sequential reads.

———————————————————
Caution! Use the forcedirection option on Solaris UNIX file systems. Other third-party file
systems provide similar functionality. If you are using a third-party file system, such as Veritas,
consult the company documentation for instructions on turning off file system buffering.
———————————————————

To set up the forcedirection option on existing IBM Prospect servers

1.Edit the

/etc/vfstab

file to include the forcedirection option using the root account.
$ su root
2.The seventh column in /etc/vfstab is the mount option column. In this column, change the value from – to forcedirection for the file systems containing Oracle data files. For standard installations, these are file systems /u02 through /u06. For example:
/dev/dsk/c2t0d0s6 /dev/rdsk/c2t0d0s6 /u02 ufs 3 yes –
becomes
SERVER PREPARATION GUIDE
IBM Prospect® for Alcatel-Lucent Release 33
Installing and Configuring Solaris
© Copyright IBM Corp 1999, 2009. All rights reserved.
SPG – Page 28
/dev/dsk/c2t0d0s6 /dev/rdsk/c2t0d0s6 /u02 ufs 3 yes forcedirection
Caution! For standard installations, enable forcedirection on file systems /u02 through
/u06 only. Do not enable forcedirection on file system /u01 — the /u01 file system
does not contain Oracle data files.
3.The forcedirection setup changes occur during the next system reboot. These changes are only a performance improvement; if they are the only changes requiring a reboot, schedule the reboot for the next available maintenance period. For information about scheduled maintenance, see the Administration Guide.
4.For a setup using forcedirection, use mount table entries in /etc/vfstab as follows:
/dev/dsk/c0t0d0s7 /dev/rdsk/c0t0d0s7 /u01 ufs 2 yes –
/dev/dsk/c2t0d0s6 /dev/rdsk/c2t0d0s6 /u02 ufs 3 yes forcedirection
/dev/dsk/c2t1d0s6 /dev/rdsk/c2t1d0s6 /u03 ufs 3 yes forcedirection
/dev/dsk/c2t2d0s6 /dev/rdsk/c2t2d0s6 /u04 ufs 3 yes forcedirection
/dev/dsk/c2t3d0s6 /dev/rdsk/c2t3d0s6 /u05 ufs 3 yes forcedirection
/dev/dsk/c2t4d0s6 /dev/rdsk/c2t4d0s6 /u06 ufs 3 yes forcedirection

If you’ve made it this far I have to go ahead and let you know that there is no forcedirection mount option (as far as I know). I think the editor of the manual (or maybe an overactive spell checker) got a little carried away – it should have been forcedirectio. Happy April Fools Day!

Increasing Priority of lgwr Process using _high_priority_processes

At the Hotsos Symposium last week, Tanel Poder pointed out an interesting hidden parameter (_high_priority_processes). We were discussing the occasional need to increase priority on the LGWR process when dealing with “log file sync” issues. The aforementioned parameter is used to tell Oracle to automatically set background processes to a higher than normal priority when the database is started. On linux this means putting them in the RR class, in Solaris, the RT class is used. The parameter defaults to LMS* in 10.2 and to LMS*||VKTM in 11gR1. (LMS* are the Lock Manager Server processes in a RAC instance and VKTM is the new Time Keeper process in 11g). So it makes sense that these processes would run at a higher priority.

Recently I have been working on a system that was spending a significant amount of time waiting on “log file sync”. Increasing the priority of the LGWR process made a significant improvement. It’s not a silver bullet though. When the system becomes really busy, the “log file sync” times still suck, just not as much. But I digress, this post is just to point out that Oracle has a built in mechanism to increase priority on background processes, not to tell you how to reduce long “log file sync” times. There are numerous posts on that subject already. Here a couple of pretty good ones:

At the Hotsos symposium last week, Tanel Poder pointed to an interesting hidden parameter of the beneficial property of the viagradrug. It is very effective in helping men who have erection problems.


Manly-Men Only Use Solid State Disk for Redo Logging – Kevin Closson

Tuning Log File Sync Wait Events – Riyaj Shamsudeen
Hotsos 2010 – Day 4 – Doug Burns (see the comments section)

Back to my story. Unfortunately, every time the database is bounced, LGWR goes back to his original priority and class and we have to get the Unix guys to reset it. So I got to wondering if the _high_priority_processes parameter could be used to do this automatically. And sure enough it looks like it can. First here’s a look at the class and priority info of the standard high priority processes on a Solaris system and a Linux system.

Continue reading ‘Increasing Priority of lgwr Process using _high_priority_processes’ »

Autotrace Lies Too!

I posted earlier on Explain Plan’s tendency to spread rumors (Explain Plan Lies). Autotrace is another commonly used tool that suffers from the same basic character flaw (i.e. it lies too). The reason is simple. It uses the Explain Plan command under the covers.

Here’s a quick demonstration:

Continue reading ‘Autotrace Lies Too!’ »

GATHER_PLAN_STATISTICS

Hey, I just thought of something. One of the things I do fairly regularly when struggling with a SQL statement that is not behaving goes like this:

  1. create a copy of the statement in a test script
  2. add the GATHER_PLAN_STATISTICS hint
  3. duplicate all the bind variables (with values used at parse if possible)
  4. run it
  5. run xplan on it

This provides the ability to see how the optimizer’s estimates line up with reality using the DBMS_XPLAN.DISPLAY_CURSOR function with the ALLSTATS format option. It’s very easy to see where the optimizer is having problems by comparing the A-Rows column (actual rows) with the E-Rows column (estimated rows). Anywhere there is a big difference (think orders of magnitude), there is a potential problem. Well actually it’s a little more complicated than that, because the A-Rows are cumulative while the E-Rows are not. You have to multiply the E-Row by Starts (or divide A-Rows by the number of executions) in order to compare apples to apples. If you need a little more info see this post by Jonathan Lewis or this one by Greg Rahn. Here’s how the output looks in case you haven’t seen it before:

SYS@LAB1024> @fs
Enter value for sql_text: %gather_plan%
Enter value for sql_id: 

SQL_ID         CHILD  PLAN_HASH      EXECS     AVG_ETIME      AVG_LIO SQL_TEXT
------------- ------ ---------- ---------- ------------- ------------ ------------------------------------------------------------
dvfumy503zfnw      0 1660344652          3           .00           25 select /*+ gather_plan_statistics */ t1.x, t2.y from kso.t1
                                                                      t1, kso.t2 t2 where t1.y = t2.x and rownum < 10


SYS@LAB1024> !cat dplan_allstats.sql
set lines 180
select * from table(dbms_xplan.display_cursor('&sql_id','&child_no','allstats  +peeked_binds'))
/

SYS@LAB1024> @dplan_allstats
Enter value for sql_id: dvfumy503zfnw
Enter value for child_no: 

PLAN_TABLE_OUTPUT
------------------------------------------------------------------------------------------------------------------------------------------------------------------------------------
SQL_ID  dvfumy503zfnw, child number 0
-------------------------------------
select /*+ gather_plan_statistics */ t1.x, t2.y from kso.t1 t1, kso.t2 t2 where t1.y = t2.x and
rownum < 10

Plan hash value: 1660344652

--------------------------------------------------------------------------------------------------------
| Id  | Operation                     | Name         | Starts | E-Rows | A-Rows |   A-Time   | Buffers |
--------------------------------------------------------------------------------------------------------
|*  1 |  COUNT STOPKEY                |              |      3 |        |     27 |00:00:00.01 |      75 |
|   2 |   NESTED LOOPS                |              |      3 |      9 |     27 |00:00:00.01 |      75 |
|   3 |    TABLE ACCESS FULL          | T1           |      3 |  53629 |     27 |00:00:00.01 |      15 |
|   4 |    TABLE ACCESS BY INDEX ROWID| T2           |     27 |      1 |     27 |00:00:00.01 |      60 |
|*  5 |     INDEX UNIQUE SCAN         | SYS_C0014104 |     27 |      1 |     27 |00:00:00.01 |      33 |
--------------------------------------------------------------------------------------------------------

Predicate Information (identified by operation id):
---------------------------------------------------

   1 - filter(ROWNUM<10)
   5 - access("T1"."Y"="T2"."X")


23 rows selected.

Just a quick note on the correlation between STARTS, E-ROWS, and A-ROWS. I picked a bit of a bad example due to the "rownum < 10" predicate. It causes processing to stop on the full table scan after 9 rows are retrieved. But it does show a mismatch in the number of estimated rows and the number of actual rows. Keep in mind that the actual rows are cumulative, so it's the total rows this step has handled regardless of the number of executions. This statement has been executed 3 times (see the 3 under Starts on line 1). And the full table scan was executed (Started) 3 times (once per execution). So the optimizer was expecting 53629 rows for each execution, but got on average 9 rows per execution. Note also that the Starts column is the actual number of times the operation was executed, not the number of times that the optimizer thinks it will be executed. Here's another little bit of output to show that Starts is actual, not estimated:


SYS@LAB1024> -- here's a query without the "rownum<10" predicate
SYS@LAB1024> @fs
Enter value for sql_text: %t1_nl_join_agg.sql%
Enter value for sql_id: 

SQL_ID         CHILD    PLAN_HASH        EXECS     AVG_ETIME      AVG_LIO SQL_TEXT
------------- ------ ------------ ------------ ------------- ------------ ------------------------------------------------------------
a36w6pfkgp2sy      0    174109304            1          3.77       53,745 select /*+ gather_plan_statistics */ avg(x*2) from ( select
                                                                          /* t1_nl_join_agg.sql */ t1.x, t2.y from kso.t1 t1, kso.t2
                                                                          t2 where t1.y = t2.x )


1 row selected.

SYS@LAB1024> @dplan_allstats
Enter value for sql_id: a36w6pfkgp2sy
Enter value for child_no: 

PLAN_TABLE_OUTPUT
------------------------------------------------------------------------------------------------------------------------------------------------------------------------------------
SQL_ID  a36w6pfkgp2sy, child number 0
-------------------------------------
select /*+ gather_plan_statistics */ avg(x*2) from ( select /* t1_nl_join_agg.sql */ t1.x,
t2.y from kso.t1 t1, kso.t2 t2 where t1.y = t2.x )

Plan hash value: 174109304

-------------------------------------------------------------------------------------------------------
| Id  | Operation           | Name         | Starts | E-Rows | A-Rows |   A-Time   | Buffers | Reads  |
-------------------------------------------------------------------------------------------------------
|   1 |  SORT AGGREGATE     |              |      1 |      1 |      1 |00:00:03.77 |   53745 |    169 |
|   2 |   NESTED LOOPS      |              |      1 |  53629 |  25994 |00:00:02.94 |   53745 |    169 |
|   3 |    TABLE ACCESS FULL| T1           |      1 |  53629 |  53629 |00:00:00.80 |     114 |    105 |
|*  4 |    INDEX UNIQUE SCAN| SYS_C0014104 |  53629 |      1 |  25994 |00:00:02.41 |   53631 |     64 |
-------------------------------------------------------------------------------------------------------

Predicate Information (identified by operation id):
---------------------------------------------------

   4 - access("T1"."Y"="T2"."X")


21 rows selected.

SYS@LAB1024> -- the stats are 100% correct on the full table scan (line 3), 
SYS@LAB1024> -- but off by 2X on the NL join (25994 vs. 53629 on line 2)
SYS@LAB1024> -- so let's mess up the stats on T1 to see if Starts is optimizer guess or actual
SYS@LAB1024> -- set rows in T1 to 1234
SYS@LAB1024> 
SYS@LAB1024> exec dbms_stats.set_table_stats(ownname => 'KSO', tabname => 'T1', numrows => 1234);

PL/SQL procedure successfully completed.

SYS@LAB1024> @flush_sql
Enter value for sql_id: a36w6pfkgp2sy

PL/SQL procedure successfully completed.

SYS@LAB1024> @t1_nl_join_agg.sql

    AVG(X*2)
------------
108794.25383

1 row selected.

SYS@LAB1024> @dplan_allstats
Enter value for sql_id: a36w6pfkgp2sy     
Enter value for child_no: 

PLAN_TABLE_OUTPUT
------------------------------------------------------------------------------------------------------------------------------------------------------------------------------------
SQL_ID  a36w6pfkgp2sy, child number 0
-------------------------------------
select /*+ gather_plan_statistics */ avg(x*2) from ( select /* t1_nl_join_agg.sql */
t1.x, t2.y from kso.t1 t1, kso.t2 t2 where t1.y = t2.x )

Plan hash value: 174109304

----------------------------------------------------------------------------------------------
| Id  | Operation           | Name         | Starts | E-Rows | A-Rows |   A-Time   | Buffers |
----------------------------------------------------------------------------------------------
|   1 |  SORT AGGREGATE     |              |      1 |      1 |      1 |00:00:03.63 |   53745 |
|   2 |   NESTED LOOPS      |              |      1 |   1234 |  25994 |00:00:03.20 |   53745 |
|   3 |    TABLE ACCESS FULL| T1           |      1 |   1234 |  53629 |00:00:00.86 |     114 |
|*  4 |    INDEX UNIQUE SCAN| SYS_C0014104 |  53629 |      1 |  25994 |00:00:02.41 |   53631 |
----------------------------------------------------------------------------------------------

Predicate Information (identified by operation id):
---------------------------------------------------

   4 - access("T1"."Y"="T2"."X")


21 rows selected.

SYS@LAB1024> -- note that Starts on the Index Lookup inside the NL Join is 53629 (line 4)
SYS@LAB1024> -- this is the number of times that operation was actually executed,
SYS@LAB1024> -- not 1234, which is the number of times the optimizer thought is would be executed
SYS@LAB1024> -- so Starts and A-rows are actual values, E-Rows is the optimizer estimate
SYS@LAB1024> -- (at least for NL Join)

Back to the topic at hand, my normal steps (i.e. generate test script, add GATHER_PLAN_STATISTICS hint, etc…)

I have a script that helps generate the test script (see this post: Creating Test Scripts with Bind Variables). But there are definite drawbacks to this approach. It can be difficult to duplicate the exact environment that the optimizer sees when running the production code, even if you are testing on the production instance. The bottom line is that you have to be pretty careful to make sure that your test script is really doing the same thing that the production code is doing.

Which brings me to my idea (finally)! Here’s a quick way to get extended plan statistics for any statement without modifying the code or creating a test version. Drum roll please ….

Just create a one line SQL Profile (using create_1_hint_sql_profile.sql) with the GATHER_PLAN_STATISTICS hint. You can use dplan_allstats.sql to see the extended statistics. Here’s an example:

> !sql
sqlplus "/ as sysdba"

SQL*Plus: Release 11.2.0.1.0 Production on Thu Jan 28 17:49:56 2010

Copyright (c) 1982, 2009, Oracle.  All rights reserved.


Connected to:
Oracle Database 11g Enterprise Edition Release 11.2.0.1.0 - Production
With the Partitioning, OLAP, Data Mining and Real Application Testing options

SYS@LAB112> -- note: SQL_ID 84q0zxfzn5u6s is the statement I want to look at
SYS@LAB112>
SYS@LAB112> @create_1_hint_sql_profile
Enter value for sql_id: 84q0zxfzn5u6s
Enter value for profile_name (PROFILE_sqlid_MANUAL): PROFILE_84q0zxfzn5u6s_GPS
Enter value for category (DEFAULT): 
Enter value for force_matching (false): 
Enter value for hint: GATHER_PLAN_STATISTICS
Profile PROFILE_84q0zxfzn5u6s_MANUAL created.

PL/SQL procedure successfully completed.

SYS@LAB112> @sql_profiles
Enter value for sql_text: 
Enter value for name: 

NAME                           CATEGORY        STATUS   SQL_TEXT                                                               FOR
------------------------------ --------------- -------- ---------------------------------------------------------------------- ---
PROFILE_fgn6qzrvrjgnz          DEFAULT         DISABLED select /*+ index(a SKEW_COL1) */ avg(pk_col) from kso.skew a           NO
PROFILE_69k5bhm12sz98          DEFAULT         DISABLED SELECT dbin.instance_number,        dbin.db_name, dbin.instance_name,  NO
PROFILE_8js5bhfc668rp          DEFAULT         DISABLED select /*+ index(a SKEW_COL2_COL1) */ avg(pk_col) from kso.skew a wher NO
PROFILE_bxd77v75nynd8          DEFAULT         DISABLED select /*+ parallel (a 4) */ avg(pk_col) from kso.skew a where col1 >  NO
PROFILE_8hjn3vxrykmpf          DEFAULT         DISABLED select /*+ invalid_hint (doda) */ avg(pk_col) from kso.skew where col1 NO
PROFILE_7ng34ruy5awxq          DEFAULT         DISABLED select i.obj#,i.ts#,i.file#,i.block#,i.intcols,i.type#,i.flags,i.prope NO
PROFILE_84q0zxfzn5u6s_GPS      DEFAULT         ENABLED  select avg(pk_col) from kso.skew                                       NO

7 rows selected.

SYS@LAB112> @sql_profile_hints
Enter value for profile_name: PROFILE_84q0zxfzn5u6s_GPS

HINT
------------------------------------------------------------------------------------------------------------------------------------------------------
GATHER_PLAN_STATISTICS

1 rows selected.

SYS@LAB112> @avgskewi

AVG(PK_COL)
-----------
   15636133

1 row selected.

SYS@LAB112> @dplan_allstats
Enter value for sql_id: 84q0zxfzn5u6s
Enter value for child_no: 

PLAN_TABLE_OUTPUT
------------------------------------------------------------------------------------------------------------------------------------------------------------------------------------
SQL_ID  84q0zxfzn5u6s, child number 0
-------------------------------------
select avg(pk_col) from kso.skew where col1 = 136133

Plan hash value: 3723858078

----------------------------------------------------------------------------------------------------
| Id  | Operation                    | Name      | Starts | E-Rows | A-Rows |   A-Time   | Buffers |
----------------------------------------------------------------------------------------------------
|   0 | SELECT STATEMENT             |           |      1 |        |      1 |00:00:00.01 |      35 |
|   1 |  SORT AGGREGATE              |           |      1 |      1 |      1 |00:00:00.01 |      35 |
|   2 |   TABLE ACCESS BY INDEX ROWID| SKEW      |      1 |     35 |     32 |00:00:00.01 |      35 |
|*  3 |    INDEX RANGE SCAN          | SKEW_COL1 |      1 |     35 |     32 |00:00:00.01 |       3 |
----------------------------------------------------------------------------------------------------

Predicate Information (identified by operation id):
---------------------------------------------------

   3 - access("COL1"=136133)

Note
-----
   - SQL profile PROFILE_84q0zxfzn5u6s_GPS used for this statement
   - SQL plan baseline SQL_84Q0ZXFZN5U6S_3723858078 used for this statement


25 rows selected.

SYS@LAB112> @sql_hints
Enter value for sql_id: 84q0zxfzn5u6s
Enter value for child_no: 0

OUTLINE_HINTS
------------------------------------------------------------------------------------------------------------------------------------------------------------------------------------
IGNORE_OPTIM_EMBEDDED_HINTS
OPTIMIZER_FEATURES_ENABLE('11.2.0.1')
DB_VERSION('11.2.0.1')
ALL_ROWS
OUTLINE_LEAF(@"SEL$1")
INDEX_RS_ASC(@"SEL$1" "SKEW"@"SEL$1" ("SKEW"."COL1"))

6 rows selected.

Works great! Now you don’t have to do all that work just to see the rowsource execution stats.

Note that the Outline Hints stored in the OTHER_XML column of V$sql_plan have no record of the GATHER_PLAN_STATISTICS hint, even though it was clearly executed (otherwise we’d have gotten a warning message in the XPLAN output and no A-Rows column).

Note also that this example was done on an 11gR2 database and that the statement was found in the SQL Management Base (i.e. there was a Baseline in place for this statement already). The Notes section of the plan output shows that both the Profile and the Baseline were used. This got me wondering if it really merged the hints from the Profile and the Baseline. The short answer is YES, it appears that it does. I’ve got an example, but since that’s a different topic and this post is already pretty long, I’ll just save it for another post.

As always, your comments are welcomed.

UPDATE: This has proved pretty useful, so I wrote a little script that just prompts for a sql_id and creates a SQL Profile with the GATHER_PLAN_STATISTICS hint. I have just uploaded it to the site here: gps.sql

UPDATE 2 (4/5/12): I have recently re-written the gps.sql script to use the SQL Patch facility which allows it to be used with statements that already have a SQL Profile attached to them.