Archive for the ‘Exadata’ Category.
June 11, 2011, 9:32 pm
Well my lone abstract submission didn’t get selected at Open World this year. But apparently they have a second chance system where you can “Suggest a Session” and users can vote on which papers they’d like to see on the agenda. I went ahead and suggested “Tuning Exadata” – It sounds like something you shouldn’t have to do, but remember that Exadata is not an appliance that has few or no knobs to turn. It has all the power and options of an Oracle database and there are certainly things that you can do wrong that will keep Exadata from performing at its best. So the paper is about how you can know for sure whether Exadata is doing what it should and how to coerce it if you need to.
The mix.oracle.com site where this voting is supposed to take place is a little difficult to navigate (in my humble opinion) so here’s a direct link to the page where you can see the abstract (and vote if you deem it worthy). 😉
You will have to log in with your Oracle Single Signon account (what you use for My Oracle Support – or Metalink for the old guys) or I think you can create an separate account if you want. By the way, Andy Colvin has submitted an abstract for a talk on Exadata Patching, which should be very informative if it gets picked. He’s done more Exadata patching than anyone I am aware of. Here’s a link to his abstract:
There will undoubtedly be many deserving abstracts. For example, several of my OakTable brethren have suggested sessions as well. So please look around the site for others of interest as well. You can vote for as many as you want.
June 6, 2011, 4:35 pm
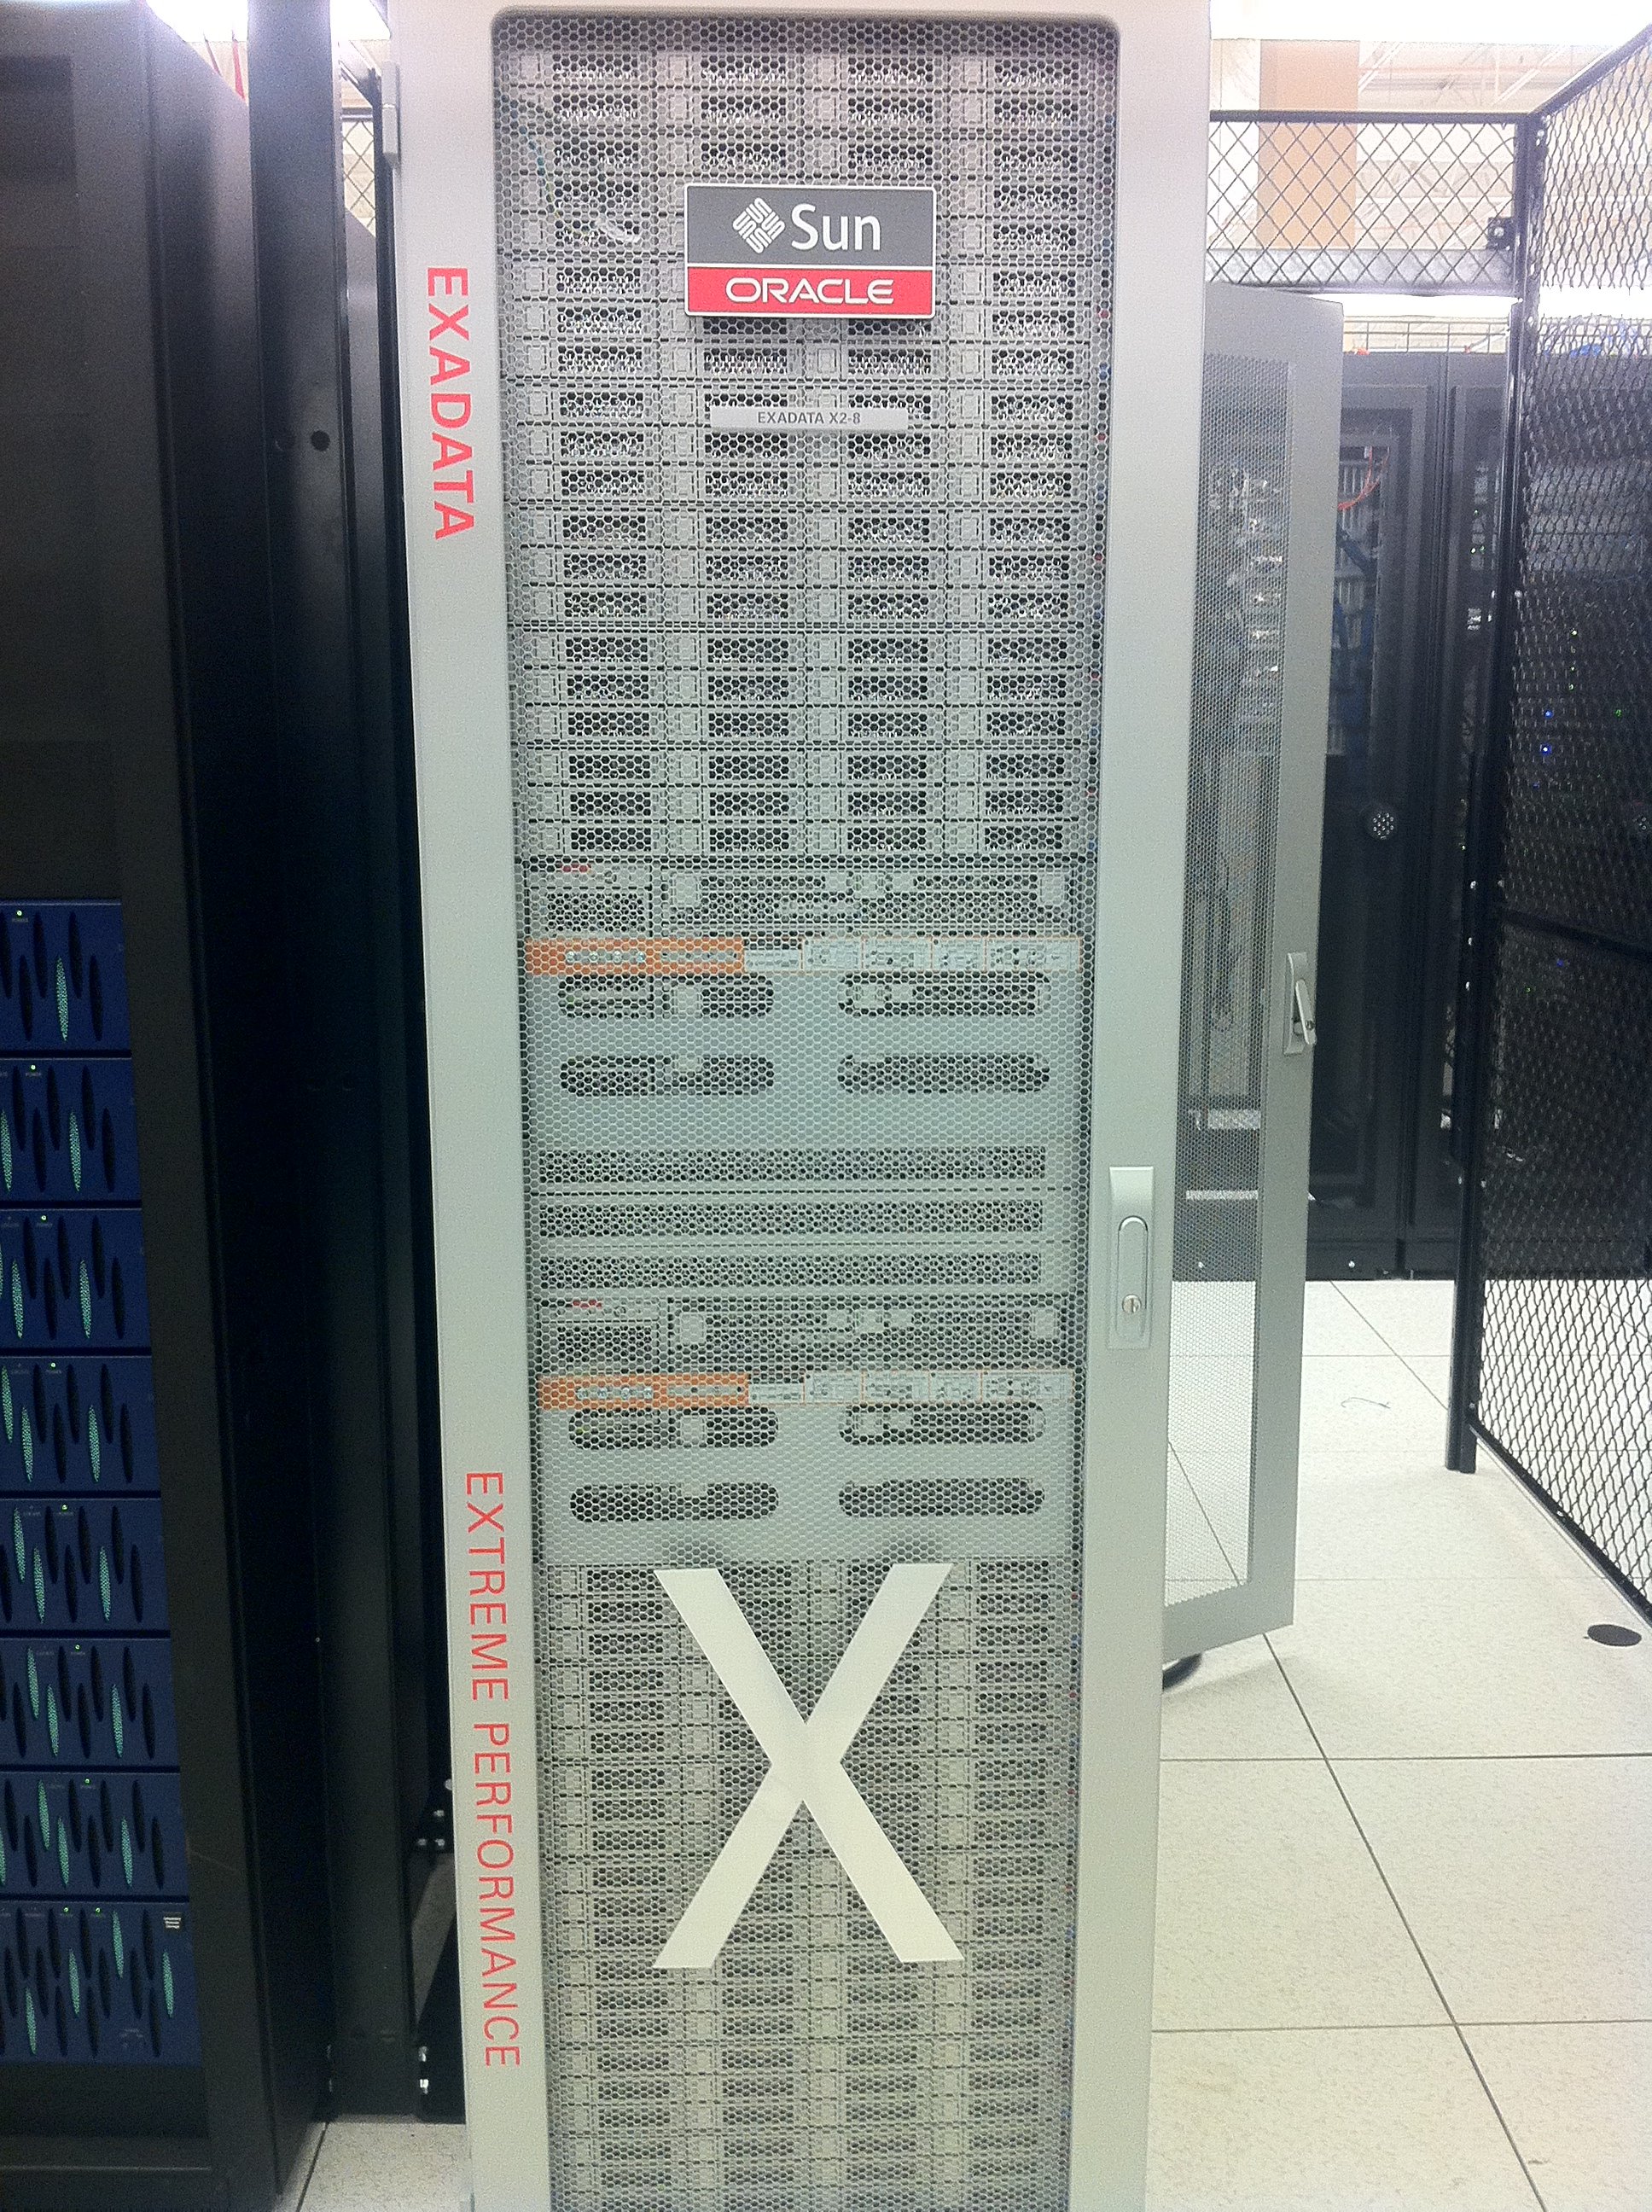
We’ve been joking around at the office about whether the Exadata X2-8 model has actually been observed in the wild. Some of the guys have been affectionately referring to it as Sasquatch because we’ve never actually seen one. Well we actually got our hands on real one today.

Not as pretty as the X2-2, but as long as it’s fast it doesn’t really matter what it looks like I guess. Thanks to Andy Colvin for the iPhone snap. We’ll be doing some testing with it soon so stay tuned. By the way, we’ve got our T-Shirts on order:

May 4, 2011, 11:09 am
I spoke at an Oracle marketing event in San Antonio last night. Here is a link to the promotional page for the event (it will probably disappear soon). I promised to make a copy of my slides available so here it is:

April 18, 2011, 8:22 pm
One of the best new features of 11g from a diagnostic standpoint is the Real Time SQL Monitoring capabilities. I did a post about it a couple of years ago here: Oracle 11g Real Time SQL Monitoring In that post I talked about a procedure (DBMS_SQLTUNE.REPORT_SQL_MONITOR) that provides a very nicely formatted explain plan type output which contains quite a bit of useful information. Well, it has recently come to my attention that the report contains a column that shows cell offloading. That’s pretty cool. Here’s a script to call that procedure, report_sql_monitor.sql, and an example (note the format is really wide so be sure and use the scroll bar at the bottom to see the columns on the right of the output):
Continue reading ‘Realtime SQL Monitoring – Designed with Exadata in Mind’ »
April 6, 2011, 9:55 pm
I got an interesting question today from a guy who is reading through the Alpha version of our Exadata Book. I’m paraphrasing, but Ajay basically wanted to know about the interaction between the relatively new Result Cache feature and Smart Scans. The short answer is that they work well together, exactly as you would hope. But let me back up for minute.
The Results Cache feature was introduced with 11gR1. It’s a pretty cool feature – Tom Kyte calls it JIT MV (just in time materialized view).
It basically caches the result set of a query as opposed to blocks from the underlying objects that are necessary to process the query. It is designed for situations where data is relatively static and fairly long running queries are repeated many times. Think of a DW that is updated nightly with some key queries that are repeated several times a day. As you might expect, the performance impact can be dramatic.
The question is interesting because Smart Scans read result sets directly into the PGA as opposed to retrieving blocks into the buffer cache. Sound familiar? Anyway, here’s an example of executing an Offloadable statement with a RESULT_CACHE hint:
SYS@SANDBOX> -- flush the result cache in case something is still hanging around
SYS@SANDBOX> exec DBMS_RESULT_CACHE.flush;

PL/SQL procedure successfully completed.

Elapsed: 00:00:00.07
SYS@SANDBOX> -- run an offloadable statement a few times
SYS@SANDBOX> select avg(pk_col) from kso.skew2 a where col1 > 1;

AVG(PK_COL)
-----------
   16049999

Elapsed: 00:00:14.34
SYS@SANDBOX> /

AVG(PK_COL)
-----------
   16049999

Elapsed: 00:00:12.16
SYS@SANDBOX> /

AVG(PK_COL)
-----------
   16049999

Elapsed: 00:00:13.01
SYS@SANDBOX> -- run the same statement with a result_cache hint
SYS@SANDBOX> select /*+ result_cache */ avg(pk_col) from kso.skew2 a where col1 > 1;

AVG(PK_COL)
-----------
   16049999

Elapsed: 00:00:11.97
SYS@SANDBOX> -- check execution statistics
SYS@SANDBOX> @fsx
Enter value for sql_text: %skew2%
Enter value for sql_id:

SQL_ID         CHILD  PLAN_HASH  EXECS  AVG_ETIME AVG_PX OFFLOAD IO_SAVED_% SQL_TEXT
------------- ------ ---------- ------ ---------- ------ ------- ---------- ----------------------------------------------------------------------
6fduhxkpdx1mc      0 4220890033      1      11.88      0 Yes          74.57 select /*+ result_cache */ avg(pk_col) from kso.skew2 a where col1 > 1
8vwynva819s92      0 4220890033      3      13.08      0 Yes          74.56 select avg(pk_col) from kso.skew2 a where col1 > 1

Elapsed: 00:00:00.13
So first I flushed all result cache entries from the SGA (it’s stored in the shared pool). Then I ran an offloadable SELECT statement 3 times.
The admittedly simple SQL statement takes between 12 and 14 seconds (the average elapsed time over three executions is 13 seconds). And the first execution with the RESULT_CACHE hint (before the Result Cache has been built) takes roughly the same amount of elapsed time. The fsx.sql script shows that both versions were offloaded and each cut out approximately the same amount of payload. (I’ve written about the fsx.sql script previously here: How to Tune an Exadata)
So clearly, using the RESULT_CACHE hint did not disable Smart Scans.
Now let’s see if Smart Scans disabled the Result Cache. To test this I’ll just run the hinted statement a few more times.
Continue reading ‘How Oracle Result Cache and Smart Scans Work Together’ »
March 26, 2011, 11:35 am
Q: How do you tune Exadata?
A: Look for long running queries that are not using Smart Scans and then fix them so they do.
We’ve worked on a bunch of Proof of Concepts (POC’s) for customers over the last year or so. These usually involve loading a few terabytes of data and running a bunch queries or some other workload on the data. Generally speaking, anything we have thrown at Exadata has blown the doors off of the platforms that the applications were previously running on. But occasionally we run into a situation where the speed up is just not what we’ve come to expect. Generally speaking it’s because we’ve done something that has kept Exadata from doing what it does best – Smart Scans. While my lead in is obviously a tongue in cheek over simplification, it is basically true. Unfortunately, it’s not as easy as it sounds to determine whether a statement has been offloaded, because our main tool for looking at how a statement was executed (the execution plan) doesn’t tell us whether a Smart Scan was used or not. So in this post, my intent is to give you a couple of options for determining whether Smart Scans are happening or not. Here’s a quick example showing a basic execution plan:
Connected to:
Oracle Database 11g Enterprise Edition Release 11.2.0.2.0 - 64bit Production
With the Partitioning, Real Application Clusters, Automatic Storage Management, OLAP,
Data Mining and Real Application Testing options


INSTANCE_NAME    STARTUP_TIME      CURRENT_TIME         DAYS    SECONDS
---------------- ----------------- ----------------- ------- ----------
SANDBOX1         24-MAR-2011 16:19 25-MAR-2011 22:57    1.28     110283

SYS@SANDBOX>
SYS@SANDBOX> set timing on
SYS@SANDBOX> @avgskew3
SYS@SANDBOX> select avg(pk_col) from kso.skew3
  2  where col1 > 0
  3  /

AVG(PK_COL)
-----------
 16093750.2

Elapsed: 00:00:34.80
SYS@SANDBOX> select sql_id, sql_text from v$sql
  2  where sql_text like 'select avg(pk_col) from kso.skew3 where col1 > 0';

SQL_ID        SQL_TEXT
------------- ----------------------------------------------------------------------
4p62g77m9myak select avg(pk_col) from kso.skew3 where col1 > 0

Elapsed: 00:00:00.14
SYS@SANDBOX> @dplan
Enter value for sql_id: 4p62g77m9myak
Enter value for child_no:

PLAN_TABLE_OUTPUT
------------------------------------------------------------------------------------------------------------------------------------------------------------------------------------
SQL_ID  4p62g77m9myak, child number 0
-------------------------------------
select avg(pk_col) from kso.skew3 where col1 > 0

Plan hash value: 2684249835

------------------------------------------------------------------------------------
| Id  | Operation                  | Name  | Rows  | Bytes | Cost (%CPU)| Time     |
------------------------------------------------------------------------------------
|   0 | SELECT STATEMENT           |       |       |       |   535K(100)|          |
|   1 |  SORT AGGREGATE            |       |     1 |    11 |            |          |
|*  2 |   TABLE ACCESS STORAGE FULL| SKEW3 |   383M|  4028M|   535K  (1)| 01:47:02 |
------------------------------------------------------------------------------------

Predicate Information (identified by operation id):
---------------------------------------------------

   2 - storage("COL1">0)
       filter("COL1">0)


20 rows selected.

Elapsed: 00:00:00.22
The storage line in the predicate section indicates that a Smart Scan is possible, but it doesn’t actually tell us that one occurred. So how can you tell. Well there are several ways.
- You can Millsap it. (generate a 10046 trace)
- You can Poder it. (use Tanel Poder’s snapper script to check stats and wait events)
- You can Wolfgang it. (generate a 10053 trace) – well actually this doesn’t work since the optimizer doesn’t know whether a statement will do a Smart Scan or not.
- Or you can look in v$sql – I wrote a little script called fsx.sql (short for Find_Sql_eXadata.sql) to do that.
I think that tracing is the most foolproof way to verify a Smart Scan (just look for “cell smart table/index scan” wait events). But it can be a little cumbersome to generate a trace and then find it. (Note: Method-R has a great tool to make this easier called MR Trace which is a plug in for Oracle’s SQL Developer). Tanel’s snapper script is an awesome tool that is very versatile – so it’s a very valid option as well. But both of these methods depend on the fact that you can catch the statement of interest while it is executing. They provide no way of looking back at statements that ran in the past. My fsx script is not nearly as comprehensive as either of these approaches, but it has an advantage in that it looks at values stored in v$sql (which are also captured in AWR by the way). This allows us to do analysis that is not limited to what is happening right now. (i.e. we don’t have to catch the query while it’s running).
So how does it work?
Continue reading ‘How to Tune an Exadata’ »
March 2, 2011, 9:52 am
I’ve had several inquiries about whether our upcoming Exadata book is part of the “Alpha” program at Apress. Honestly, I wasn’t even familiar with the program so I asked our editor, Jonathan Gennick, and found out that our book is part of the program. Tanel already did a post explaining how it works here:
I just wanted to follow up with a quick post since I’d had a few questions about it already. It’s actually pretty cool if you are anxious to get your hands on the material. It’s also interesting because you can see how the book writing process goes. You basically have access to draft versions of chapters as the authors turn them in – warts and all. Then you’ll get emails when the chapters are updated as they go through the reviewing and editing process. Here’s a link to the Apress page where you can see all the details:
So welcome to the future where everyone can see everything you’re doing. Next thing you know we’ll all be wearing jet packs.
February 17, 2011, 8:51 pm
Just a quick post (mostly so I can find the info quickly myself when I want it). Here’s how to get the master serial number for an Exadata Rack:
ipmitool sunoem cli ‘show /SP system_identifier’
Apparently by convention the Exadata Rack serial number is appended to the end of ILOM system identifier string. Here’s an example:
[enkdb01:root] /root
> ipmitool sunoem cli 'show /SP system_identifier'
Connected. Use ^D to exit.
-> show /SP system_identifier

  /SP
    Properties:
        system_identifier = Sun Oracle Database Machine _YOUR_SERIAL_NUMBER_HERE_


-> Session closed
Disconnected
Thanks to Dan Norris for that bit of info.
You can also get the individual serial numbers for each component in an Exadata Rack like this:
/opt/oracle.SupportTools/CheckHWnFWProfile -S
So you would log on to each machine and run this. Here’s the output from one of the DB Servers in our system:
Continue reading ‘Exadata Serial Numbers’ »
February 9, 2011, 7:50 pm
I have been getting quite a few questions about our upcoming Exadata Book lately so I thought I would post a quick update. We are working feverishly on it so please give us a break!

Just kidding!
I am actually feeling like we can see the light at the end of the tunnel now. We are well past the half way mark and I am feeling confident about the content. Well more than confident actually. I think it’s going to be awesome! In large part that’s due to the fact that I feel like we have the Dream Team working on the project. Tanel Poder has signed on as a co-author. Kevin Closson is the Official Technical Reviewer (and we’re tentatively planning on including a number of his comments in the book – in little “Kevin Says” sidebars). As one of the main architects of Exadata, this should provide some interesting perspective. Arup Nanda has volunteered as an unofficial technical reviewer as well. I have to say that Arup has been a great help. And I really appreciate him providing another perspective on what we’re writing about. All three of these guys are fellow Oak Table bretheren, by the way. Randy Johnson is the other co-author, and although he generally prefers to keep a low profile, he is extremely knowledgeable on things that the rest of us don’t deal with that much on a day to day basis, namely backup and recovery and storage configuration. He has a great RAC and ASM background as well. I have to also say that a guy none of you has ever heard of (Andy Colvin) has been a huge help as well. He is our in-house Exadata patching guru. Without him I’m not sure we would have been able to do the necessary testing to complete the book.
I must say that I feel honored to be involved in a project with such an accomplished group of guys. And by the way, we have had numerous offers from people that I have a lot of respect for to help with various aspects of the project. I want to thank all of you for those offers, even if we haven’t taken you up on all of them (our little brains can only absorb so much feedback at any one time). The book is actually available for pre-order on the Amazon already (so someone must think we are actually going to finish it pretty soon). I think we’re right on track for later spring delivery. 🙂
January 30, 2011, 7:52 pm
Ever wonder why that weird line shows up in the Predicate Section of an execution plan on Exadata? Me too! The STORAGE bit tells us it’s a filter applied at the storage cell layer, but the rest is nonsensical. Well I recently ran across a very brief mention of it in a Metalink note. (I know it’s not called Metalink any more, but I’m kind of set in my ways). The note said it was related to distribution of rows to PX slaves. Ah ha! Let’s test it out. Here’s a plan with the predicate just so you can see what it looks like.
KSO@arcp> @dplan
Enter value for sql_id: a9axwj6ym3b29
Enter value for child_no:

PLAN_TABLE_OUTPUT
------------------------------------------------------------------------------------------------------------------------------------------------------
SQL_ID  a9axwj6ym3b29, child number 0
-------------------------------------
select /*+  parallel_index(t, "ISD_SI_I03",8)  dbms_stats
cursor_sharing_exact use_weak_name_resl dynamic_sampling(0)
no_monitoring no_substrb_pad  no_expand index_ffs(t,"ISD_SI_I03") */
count(*) as nrw,count(distinct sys_op_lbid(725425,'L',t.rowid)) as
nlb,count(distinct hextoraw(sys_op_descend("SUPPORT_LEVEL")||sys_op_desc
end("SUPPORT_LEVEL_KEY")||sys_op_descend("NAME")||sys_op_descend("VALUE"
))) as ndk,sys_op_countchg(substrb(t.rowid,1,15),1) as clf from
"ISD"."SUPPORT_INFO" sample block (   .0503530742,1)  t where
"SUPPORT_LEVEL" is not null or "SUPPORT_LEVEL_KEY" is not null or
"NAME" is not null or "VALUE" is not null

Plan hash value: 1766555783

---------------------------------------------------------------------------------------------------------------------------------------
| Id  | Operation                                   | Name       | Rows  | Bytes | Cost (%CPU)| Time     |    TQ  |IN-OUT| PQ Distrib |
---------------------------------------------------------------------------------------------------------------------------------------
|   0 | SELECT STATEMENT                            |            |       |       |   672 (100)|          |        |      |            |
|   1 |  SORT GROUP BY                              |            |     1 |    56 |            |          |        |      |            |
|   2 |   PX COORDINATOR                            |            |       |       |            |          |        |      |            |
|   3 |    PX SEND QC (RANDOM)                      | :TQ10001   |     1 |    56 |            |          |  Q1,01 | P->S | QC (RAND)  |
|   4 |     SORT GROUP BY                           |            |     1 |    56 |            |          |  Q1,01 | PCWP |            |
|   5 |      PX RECEIVE                             |            |     1 |    56 |            |          |  Q1,01 | PCWP |            |
|   6 |       PX SEND HASH                          | :TQ10000   |     1 |    56 |            |          |  Q1,00 | P->P | HASH       |
|   7 |        SORT GROUP BY                        |            |     1 |    56 |            |          |  Q1,00 | PCWP |            |
|   8 |         PX BLOCK ITERATOR                   |            |   397K|    21M|   672   (1)| 00:00:01 |  Q1,00 | PCWC |            |
|*  9 |          INDEX STORAGE SAMPLE FAST FULL SCAN| ISD_SI_I03 |   397K|    21M|   672   (1)| 00:00:01 |  Q1,00 | PCWP |            |
---------------------------------------------------------------------------------------------------------------------------------------

Predicate Information (identified by operation id):
---------------------------------------------------

   9 - storage(:Z>=:Z AND :Z<=:Z AND ("SUPPORT_LEVEL" IS NOT NULL OR "SUPPORT_LEVEL_KEY" IS NOT NULL OR "NAME" IS NOT NULL OR
              "VALUE" IS NOT NULL))
       filter(("SUPPORT_LEVEL" IS NOT NULL OR "SUPPORT_LEVEL_KEY" IS NOT NULL OR "NAME" IS NOT NULL OR "VALUE" IS NOT NULL))


37 rows selected.
Notice that the plan is for a PX statement. So how can we convince ourselves that it is a PX related predicate. We can try two tests.
- Let's see if we can find any SQL statements that have the predicate that aren't PX statements.
- Let's see if we can find any PX statements that don't have the predicate.
So here we go.
Continue reading ‘storage(:Z>=:Z AND :Z’ »
